
Key points:
- Australian employment growth rose strongly in October, following slower growth throughout 2025.
- Australia’s unemployment rate eased to 4.3%, but employment and population growth suggest it may rise in coming months.
- Stronger-than-expected employment growth vindicated the Reserve Bank’s decision not to cut rates at their November meeting.
Australian employment rose by 42,000 people in October, exceeding market expectations, with the unemployment rate easing to 4.3%.
The headline figures in October were all very positive. Employment up strongly, the unemployment and underemployment rates down, hours worked up. That’s in stark contrast with recent labour market trends.
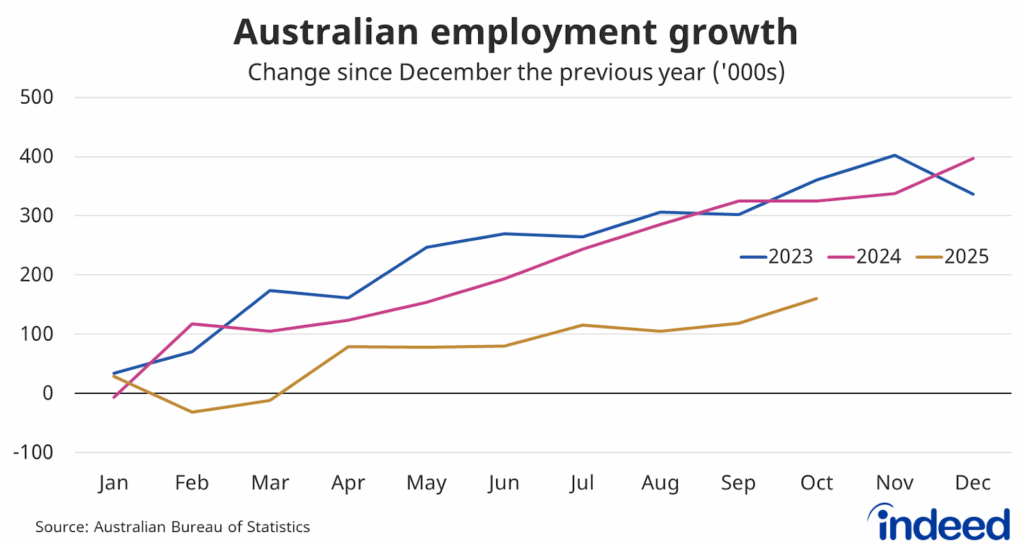
However, there are still some genuine concerns. Australian employment growth has been sluggish this year. Even after adding another 42,000 people in October, employment has increased by just 160,000 people over the first ten months of the year. That compares to a gain of 325,000 people over the same period last year.
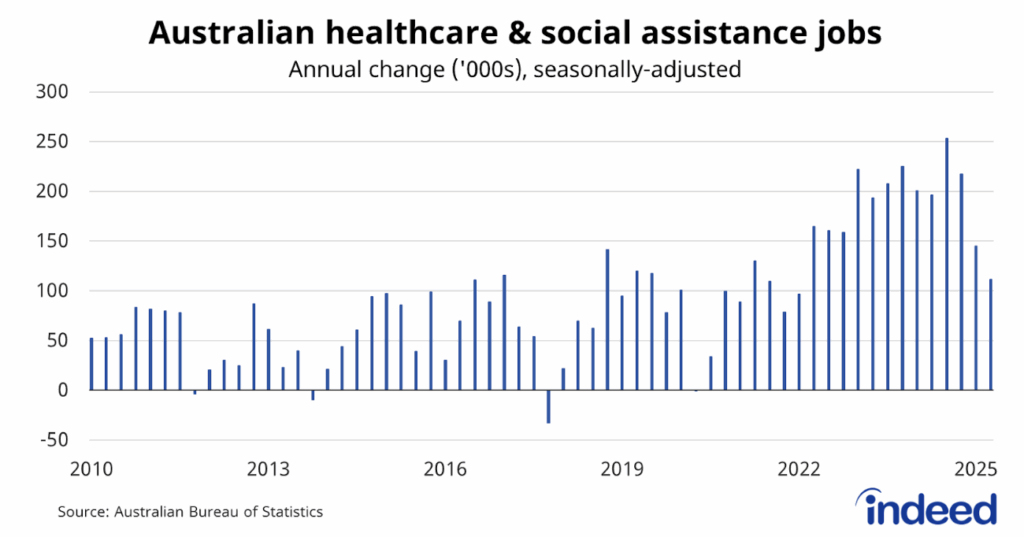
The main reason for this slowdown has been reduced hiring in healthcare & social assistance — the industry that drove so much of Australia’s post-pandemic job boom. Healthcare & social assistance expanded by 112,000 jobs over the past year, down from an annual peak of 253,000 in the September quarter last year.
Thus far, the private sector — which has been heavily impacted by a challenging economic environment — hasn’t been able to fill the gap created by reduced hiring across the healthcare sector.
Unemployment measures decline
In October, Australia’s unemployment rate eased to 4.3% after reaching a four-year high of 4.5% in September. The underemployment rate also eased to 5.7%, down from 5.9%, to be near its lowest level this century.
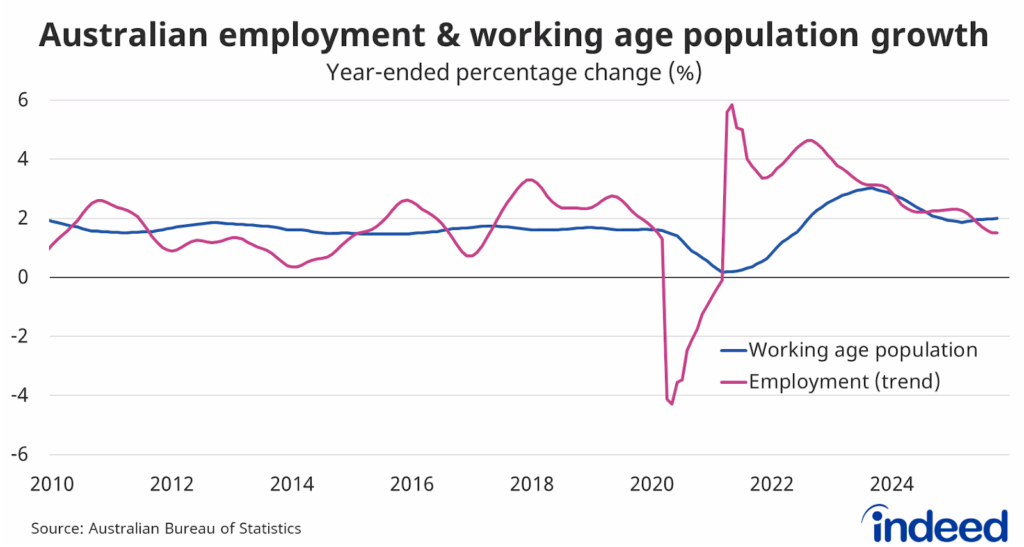
Australia’s labour market is still tight, but it’s likely that the unemployment will drift higher in the near-term because employment growth is no longer keeping pace with growth in Australia’s working-age population.
Assessment and implications
Stronger-than-expected jobs data will offer vindication for the Reserve Bank and guarantees that the next few meetings are unlikely to lead to any change in the cash rate.
The RBA’s primary focus at the moment is on inflation, and it won’t lower rates further until it’s convinced that the current outbreak is under control. The labour market would have to deteriorate considerably for the RBA to overlook relatively high inflation.