
Key Points
- Australian job postings fell a further 5.9% in February and are down 17% since the end of last year.
- Postings in almost every occupational category have fallen over the past three months, with postings in 70% of occupations down 10% or more.
- Australia’s job vacancy rate remains elevated at 2.8%, twice its pre-pandemic average, with the vacancy rate for mining and accommodation & food services 4.5% and 3.9%, respectively.
While the overall demand for workers remains strong, easily exceeding pre-pandemic conditions, there are clear signs that Australian labour market conditions are cooling.
Australian job postings continue to fall
Australian job postings on Indeed fell 5.9% in February compared to a month earlier, leaving postings 1.9% lower than February 2022 and down 17% since the end of last year. Nevertheless, labour demand remains strong, with Australian postings still more than twice as high as they were prior to the pandemic.
We expect posting levels to decline further this year due to an increasingly challenging economic environment. High inflation and rising interest rates are likely to weigh on job creation as businesses become more concerned about the outlook for their operations and the broader economy.
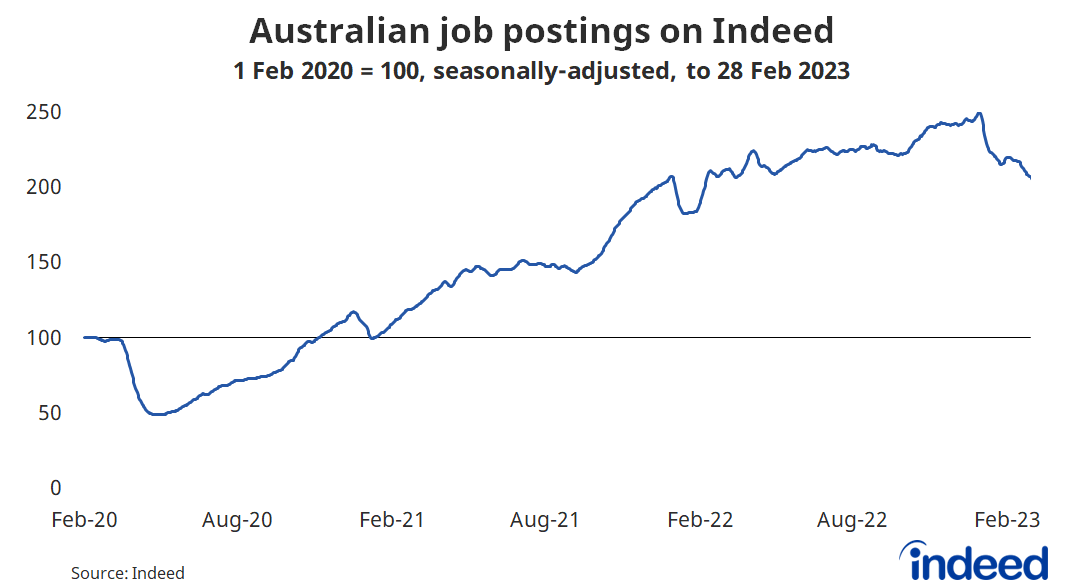
The decline in postings during February was broad-based across Australian states. Tasmania led the way, down 16.5%, followed by a 7.6% fall in Western Australia. The biggest contributors to the overall national decline came from the larger states of New South Wales and Victoria, where postings fell by 6.8% and 5.6%, respectively.
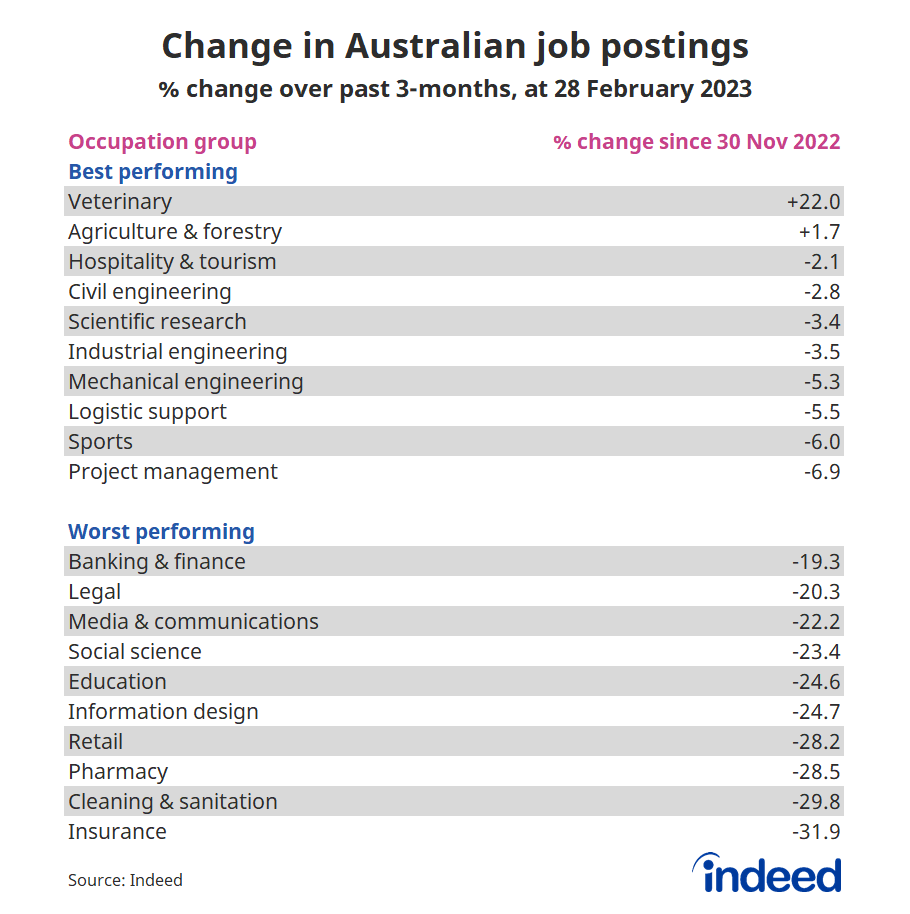
Postings falling across almost every occupational category
Over the past three months, postings in almost every occupational category have declined, with 70% of occupations falling by at least 10%.
Since the end of November, postings for just two occupational groups — veterinary and agriculture — have increased. Postings for roles in sectors including hospitality & tourism, scientific research and a range of engineering roles have shown only modest declines.
Postings for retail positions have declined 28% over the past three months, partly reflecting the post-Christmas period but perhaps also an expectation that retail conditions could sour as the economy slows. Australia’s household sector is navigating a combination of high inflation, rising interest rates and falling wealth which is expected to weigh heavily upon household spending this year.
Spotlights: Australia’s job vacancy rate still skyhigh
In the December quarter, 2.8% of Australian jobs nationwide were vacant, around twice the “normal” rate in the decade prior to the pandemic. The job vacancy rate has declined from its peak and, based on Indeed’s more timely data, is likely to decline further during the March quarter.
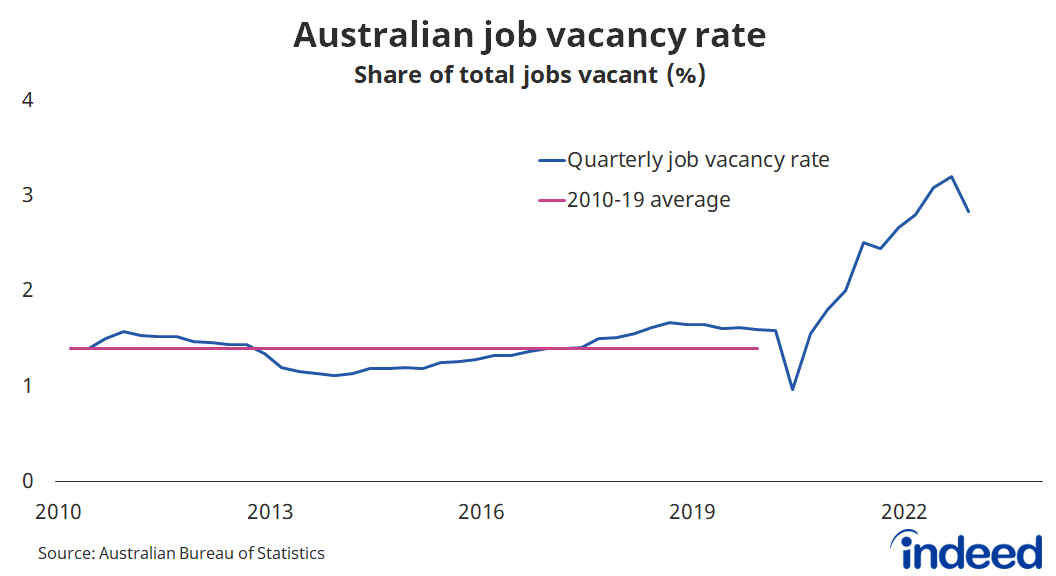
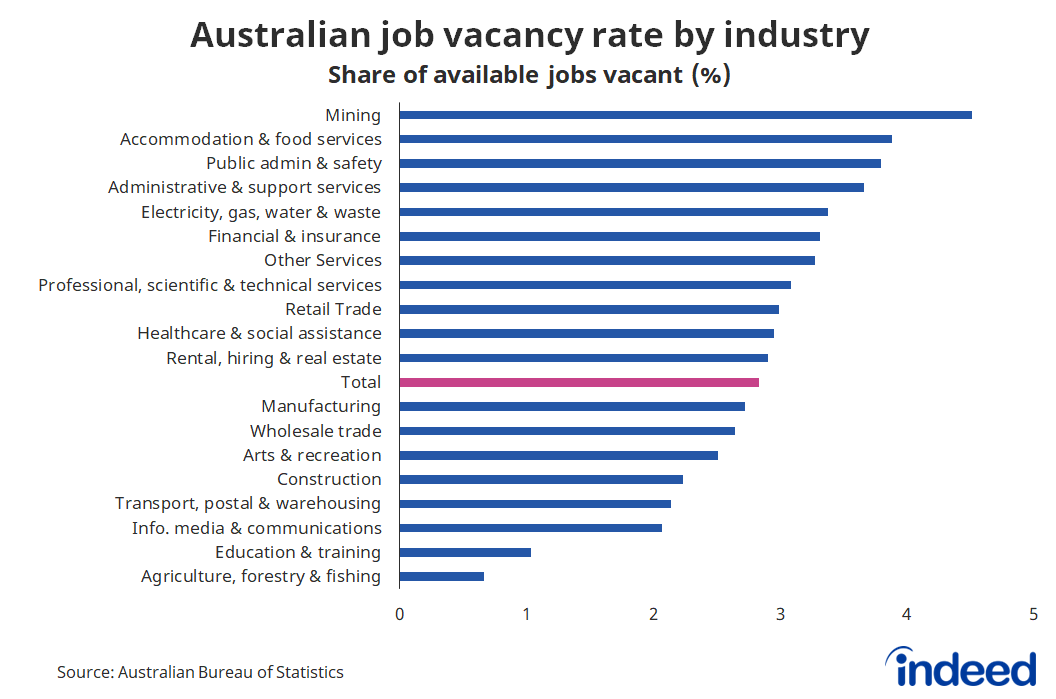
The vacancy rate in mining and accommodation & food services – the two industries with the consistently highest vacancy rates over the past year – is 4.5% and 3.9%, respectively. Public administration & safety and administrative & support services were not far behind.
The Australian labour market finds itself at an interesting juncture. Job postings have fallen considerably from their peak, with postings for almost every occupational category lower now than three months ago, but that hasn’t yet translated into higher unemployment. By any reasonable measure, Australia is still in a jobs boom, with plentiful though somewhat reduced opportunities.
Methodology
All posting figures in this blog post are derived from seasonally adjusted job postings. We seasonally adjust each series based on historical patterns in 2017, 2018 and 2019. Each series, including the national trend, occupational sectors and sub-national geographics is seasonally adjusted separately. We adopted this methodology in January 2021.
The national and regional analysis is based on the percentage change in job postings on Indeed’s Australia site since February 1, 2020, our pre-pandemic baseline.
The number of job postings on Indeed.com, whether related to paid or unpaid job solicitations, is not indicative of potential revenue or earnings of Indeed, which comprises a significant percentage of the HR Technology segment of its parent company, Recruit Holdings Co., Ltd. Job posting numbers are provided for information purposes only and should not be viewed as an indicator of performance of Indeed or Recruit. Please refer to the Recruit Holdings investor relations website and regulatory filings in Japan for more detailed information on revenue generation by Recruit’s HR Technology segment.
The data from the Australian Bureau of Statistics comes from the Labour Account report.