
Key Points
- While the Australian labour market remains incredibly tight by historical standards, most major labour market metrics have softened in recent months, led by an increase in the unemployment rate.
- Australian job postings fell sharply in January, down 11.8% when compared to December 2022. While this is a significant decrease, it’s important to recognize the drop partly reflects a changing seasonal pattern for postings during January which has been observed during the pandemic recovery.
- Despite the large January decline, there are still more than twice as many job postings in January as there were prior to the pandemic.
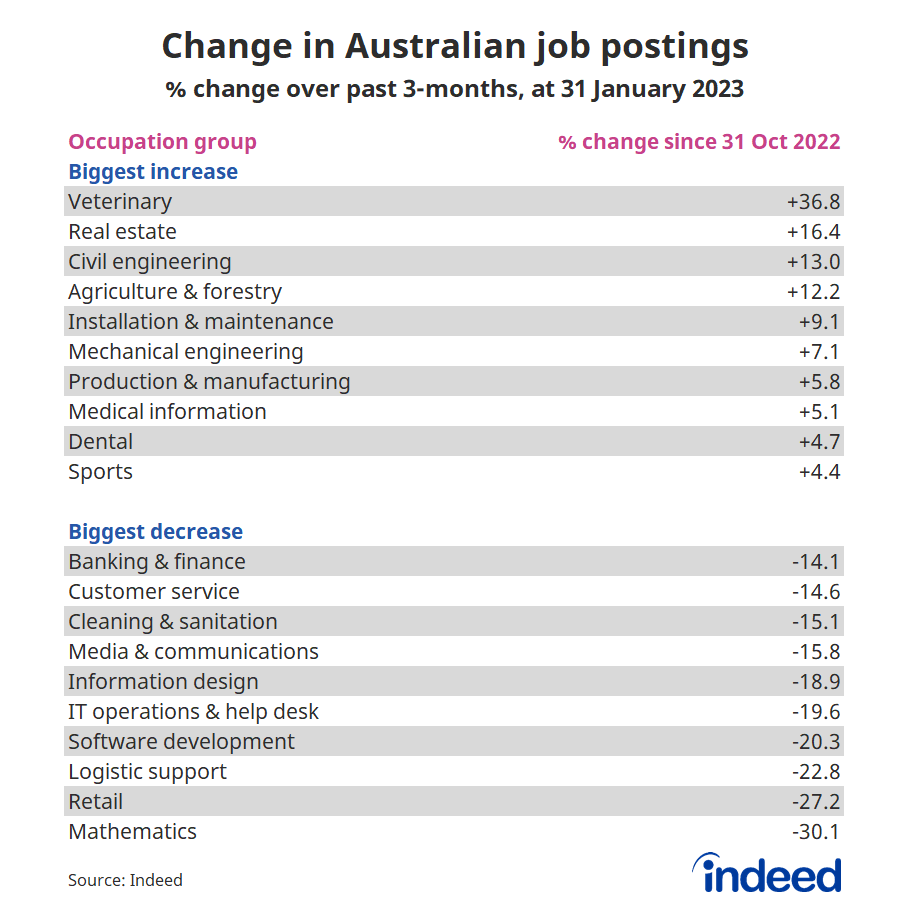
- Postings in three-quarters of Australia’s occupational groups fell over the past three months, led by sharp falls in mathematics and retail postings.
This month’s labour market update reveals the sharp decline in Australian job postings in January and highlights how various labour market metrics have shifted in recent months.
Australian job postings fall sharply
While the demand for workers remains strong, there are tentative signs that labour market conditions are starting to cool.
By the end of January, job postings on Indeed had fallen 11.8% compared to a month earlier. Still, last month’s job postings were 16.6% higher than a year ago. Despite the large January decline, there are still more than twice as many job postings in January as there were prior to the pandemic.
The monthly decline partly reflects a changing seasonal pattern for January. Before the pandemic, job postings would normally increase sharply in January, following low levels of hiring over the Christmas period. While postings have increased in both January 2022 and 2023 – before seasonal adjustment – the gains haven’t been as large as they used to be. In practical terms, that means that January estimates for postings are lower than they should be and that will be offset by other months being a little higher than they should be.
Australian job postings also remain high by international standards, with growth well above the US, UK and Canada.
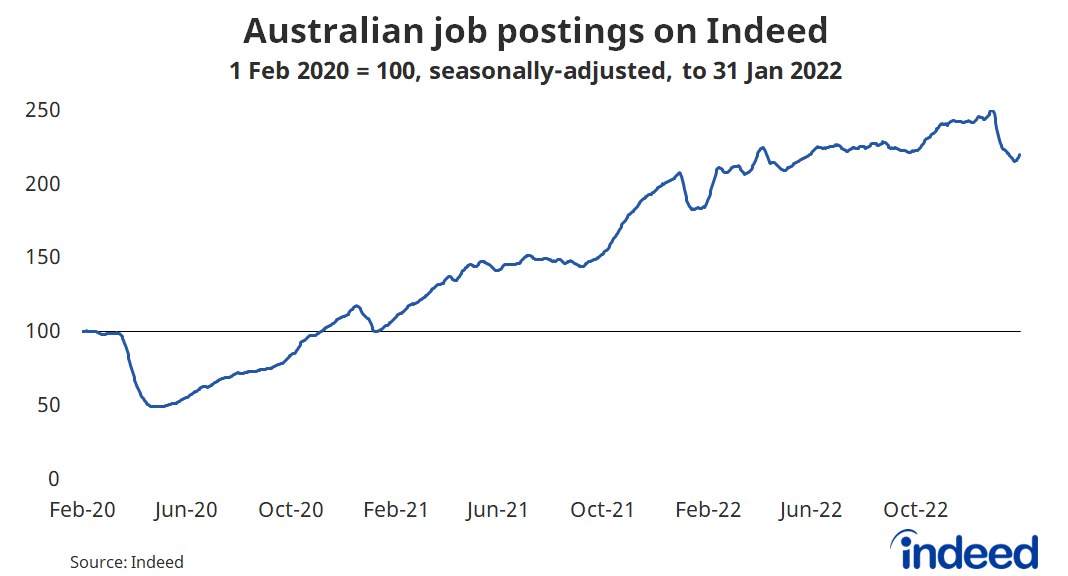
The January decline was broad-based across Australian states, led by a 13.4% fall in New South Wales, a 13.2% decline in Queensland and a 12.5% fall in Victoria.
Postings falling in most occupational groups
Over the past three months, postings in three-quarters of occupational categories have declined, with 38% of occupations falling by at least 10%.
Since the end of October, postings for mathematics roles have fallen by 30%, ahead of a 27% decline in retail roles and a 23% fall in logistic support postings.
Given the presence of seasonality in the national figures, occupations with the largest decline in job postings may reflect those occupations where hiring has become more seasonal during the pandemic recovery than they were before the pandemic began.
However, hiring in some occupations continues to grow, led by veterinary (+37%), real estate (+16%) and civil engineering (+13%) roles. Strong growth in real estate opportunities might come as a surprise given the ongoing fall in property prices in response to rising mortgage rates.
Spotlight: The Australian labour market has started to cool
Following the release of January’s Labour Force Survey, there is tentative evidence that labour market conditions are starting to slow down.
- Unemployment rate: 3.4% (Oct 2022) → 3.7% (Jan 2023)
- Underemployment rate: 5.8% (Nov 2022) → 6.1% (Jan 2023)
- Underutilisation rate: 9.3% (Nov 2022) → 9.8% (Jan 2023)
- Employment: ↓ 31,400 people since November.
- Participation rate: ↓ 0.3 percentage points since November.
It’s important to note that Australia’s labour market remains incredibly tight by historical standards, with employment increasing sharply over the past year and participation in the workforce still well above pre-pandemic levels. Forward-looking measures of labour demand, such as Indeed’s job postings, remain fairly healthy and consistent with low levels of unemployment.
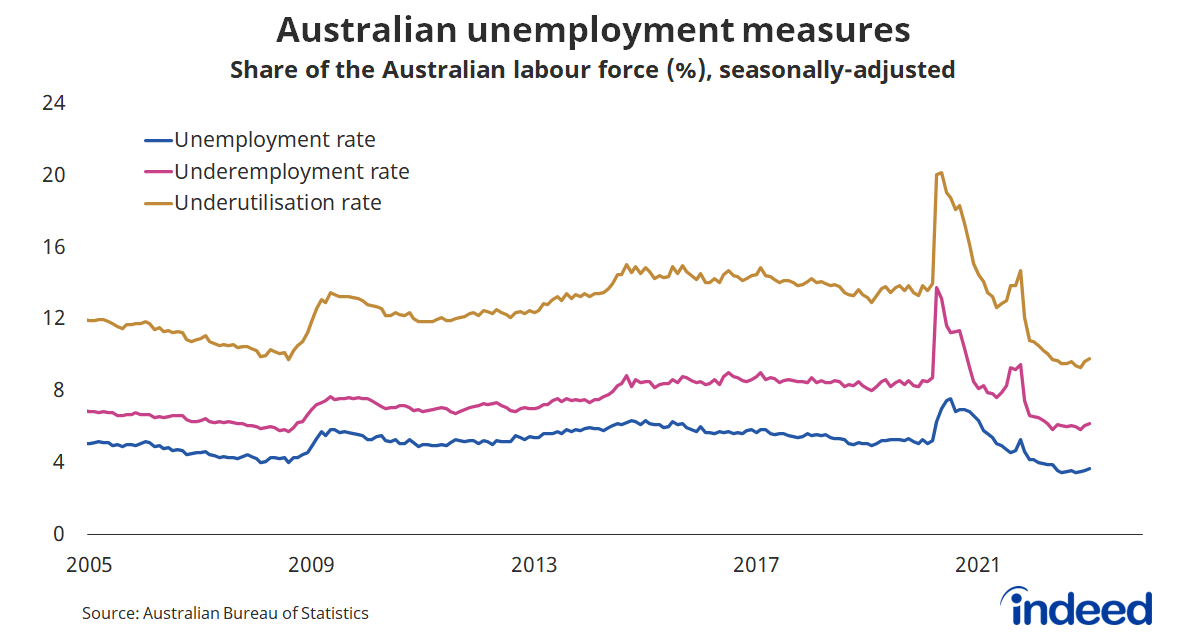
Nevertheless, the combination of high inflation and rising interest rates is having a real-world impact and cracks are starting to appear across Australia’s otherwise strong labour market. Policymakers, such as the Reserve Bank of Australia and federal Treasury, will be closely watching these metrics as they attempt to fine-tune monetary policy and May’s federal budget, respectively.
Methodology
All posting figures in this blog post are derived from seasonally adjusted job postings. We seasonally adjust each series based on historical patterns in 2017, 2018 and 2019. Each series, including the national trend, occupational sectors and sub-national geographics is seasonally adjusted separately. We adopted this methodology in January 2021.
The national and regional analysis is based on the change in job postings on Indeed’s Australia site since February 1, 2020, our pre-pandemic baseline.
The number of job postings on Indeed.com, whether related to paid or unpaid job solicitations, is not indicative of potential revenue or earnings of Indeed, which comprises a significant percentage of the HR Technology segment of its parent company, Recruit Holdings Co., Ltd. Job posting numbers are provided for information purposes only and should not be viewed as an indicator of performance of Indeed or Recruit. Please refer to the Recruit Holdings investor relations website and regulatory filings in Japan for more detailed information on revenue generation by Recruit’s HR Technology segment.
The ABS labour market metrics can be found here.