
Key Points
- Australia’s labour market is as tight as it has been in half a century.
- Job creation remains strong, with Indeed job postings and national job vacancies still more than double pre-pandemic levels.
- High inflation has eroded the purchasing power of Australian incomes, representing a clear threat to the national economy next year.
In 2022, the Australian labour market went from strength-to-strength. Here are some of the highlights:
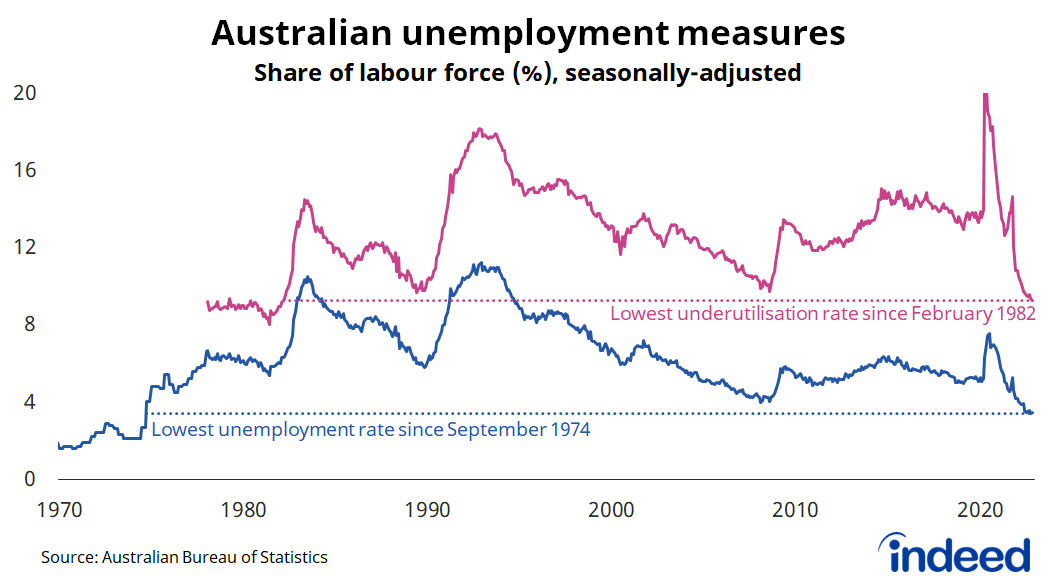
- The unemployment rate fell to 3.4% — its lowest level since September 1974.
- The underutilisation rate — which includes both unemployed and underemployed people — fell to a 40-year low of 9.3%
- The nation’s participation rate — the share of the working age population either employed or seeking employment — reached a record high.
- Wage growth lifted to its highest level in a decade.
- Job vacancies reached 496,000, which was more than double the pre-pandemic record.
In short, almost every major labour market metric is doing things we haven’t seen before or haven’t seen in a very long time.
Despite Australia’s record-breaking labour market, we enter 2023 under a cloud of uncertainty, facing a range of challenges that may result in an economic slowdown and, perhaps, a deterioration of labour market conditions. The Reserve Bank of Australia expects the unemployment rate to increase modestly next year, to 3.7%, as household spending growth slows.
The cause for concern is high inflation and rising interest rates. Some global economies are already talking about recessions but that’s considered an unlikely scenario for Australia. Nevertheless, high inflation has eroded the purchasing power of Australian wages and salaries, while falling asset prices and rising mortgage repayments weigh heavily on Australian households.
In our final blog post of 2022, we will focus on the elevated demand for workers, some of the strategies that employers have used to stand out in a tight labour market, the impact of inflation on wages and the population dynamics that will influence recruitment next year.
Australian job creation continues to run hot
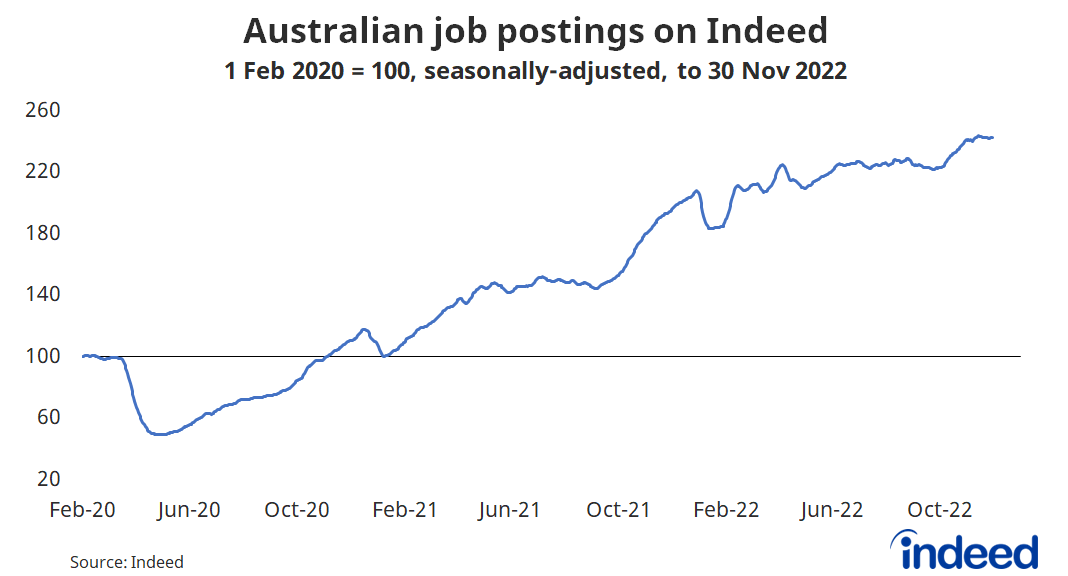
But it isn’t all doom and gloom. Forward-looking indicators of labour demand, such as Indeed job postings, remain incredibly strong. By the end of November, job postings were up 7% since mid-year and up 24% compared to a year ago.
This suggests that employers remain optimistic about economic conditions and the outlook for their respective businesses. Before the unemployment rate begins to increase, we’d expect job postings to decline considerably.
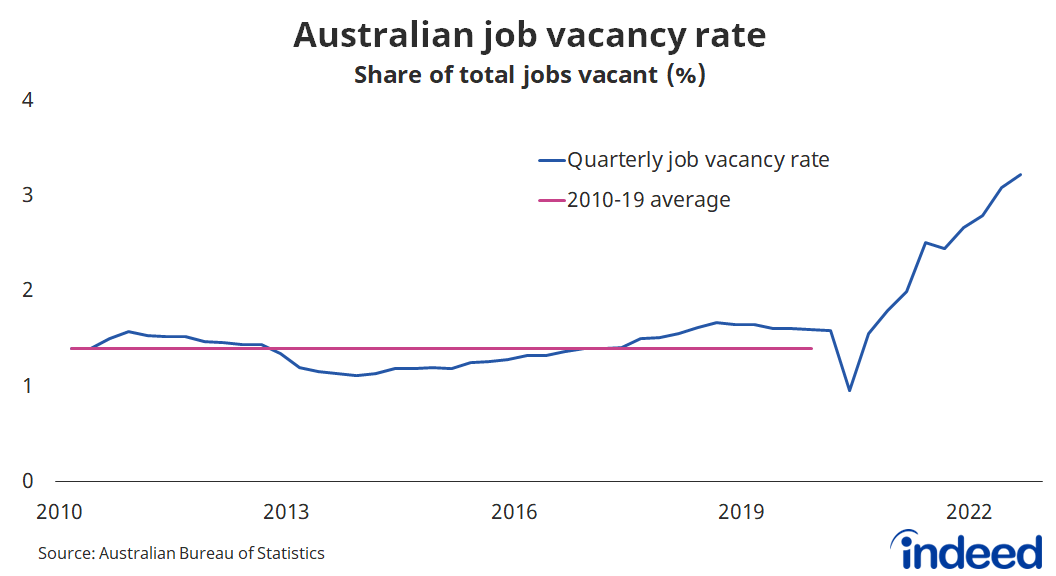
Overall, 3.2% of Australian jobs were vacant in the September quarter, around 2.3 times higher than the average rate from 2010 to 2019. While the vacancy rate for every industry is above pre-pandemic levels, it is highest in mining and accommodation & food services. There is roughly one unemployed person per job vacancy nationwide, down from 3.1 people before the pandemic. The biggest labour market issue Australia faced this year was a lack of people capable of filling all the roles that were being created.
Employers using benefits to stand out from their peers
In a tight labour market experiencing widespread skill shortages, employers have tried to differentiate themselves by placing greater emphasis on the benefits they offer. Two great examples of this are signing bonuses and paid parental leave.
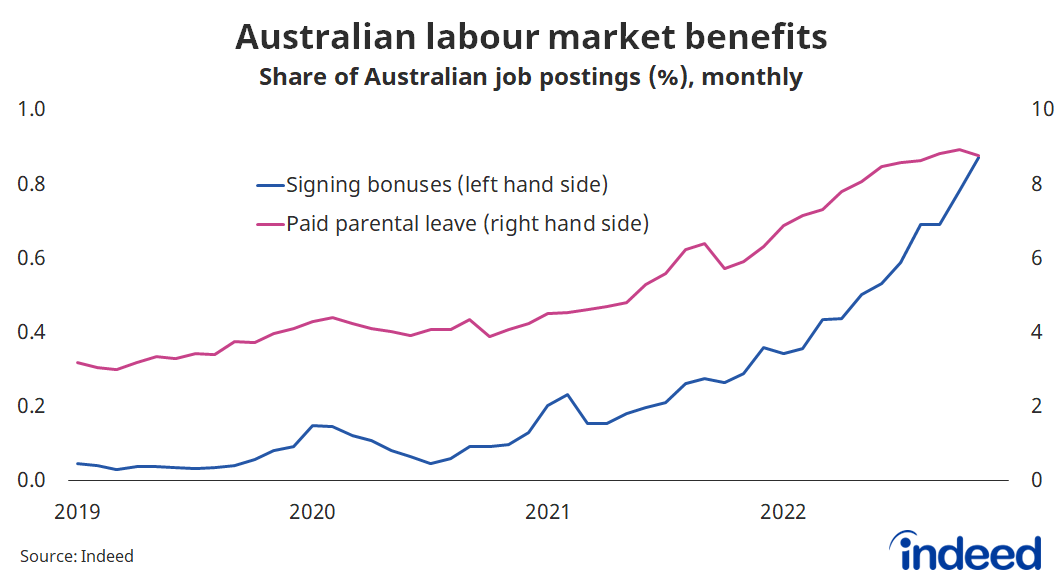
In November, references to signing bonuses in Australian job descriptions were three times higher than a year ago. Signing bonuses have been increasingly common among roles where working from home is either not viable or quite difficult, with employers offering additional incentives to lure jobseekers from the comfort of home.
In addition, paid parental leave offerings were another point of emphasis for Australian employers. In November, 8.8% of Australian job postings explicitly mention paid parental leave policies, up from 5.9% a year ago.
Greater emphasis on job benefits is a trend that is likely to persist next year. Even if demand for workers subsides a little, many industries and occupations will still be dealing with labour shortages that will require employers to up their game to attract candidates.
Australian households are suffering from high inflation
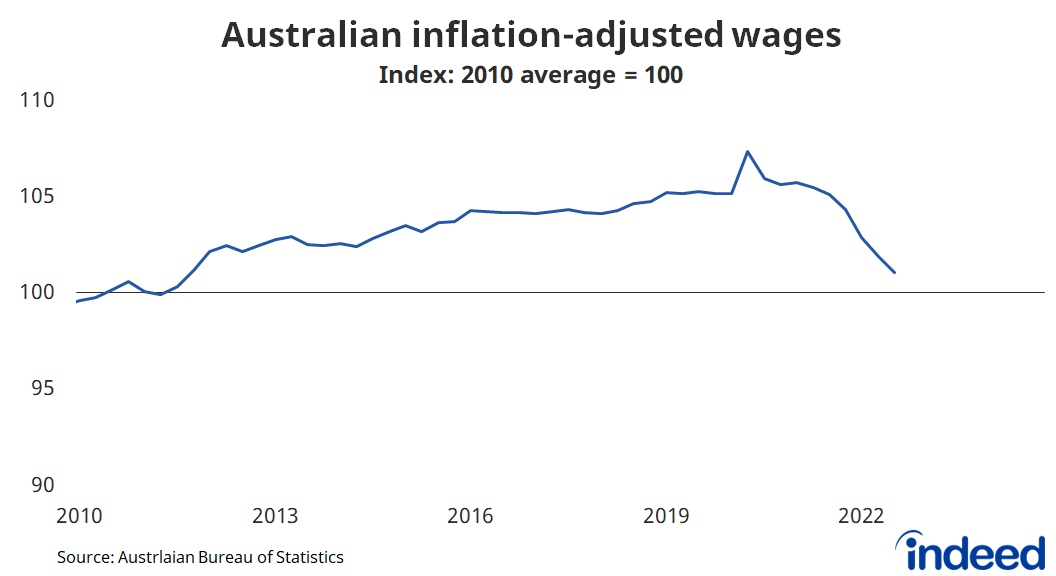
High inflation established itself as Australia’s biggest economic problem early in the year and we don’t expect much will change in the new year. Adjusted for inflation, Australian wages fell by 3.9% over the past year and are currently at their lowest level in eleven years. Unless you’ve received a promotion or changed employer recently, there is a good chance that your salary buys a lot less this year than it did last year and every year in the decade that preceded it.
It is little wonder then that consumer confidence has fallen to within an inch of its April 2020 pandemic low, having already surpassed the low point established during the global financial crisis. What’s interesting is that this lack of confidence hasn’t yet translated into reduced spending. Instead, we have an unusual situation where confidence measures point to a recession, while actual spending patterns point to a boom. That surely cannot continue next year.
If households rein in their spending, we’d expect that to primarily impact non-discretionary items, particularly in retail, tourism and eating out. Job postings for each of these areas have held up well through the end of November but they will be one’s to watch next year.
Australians seeking multiple jobs to combat higher cost-of-living
One way that Australians are dealing with the cost-of-living crisis is by finding more hours, which often involves finding a second or even third job.
In the September quarter, 6.5% of employed people were working two or more jobs, that’s up from 5.8% a year ago. The share of workers with multiple jobs has increased considerably throughout the pandemic, rising above its historical range of 5 to 6%.
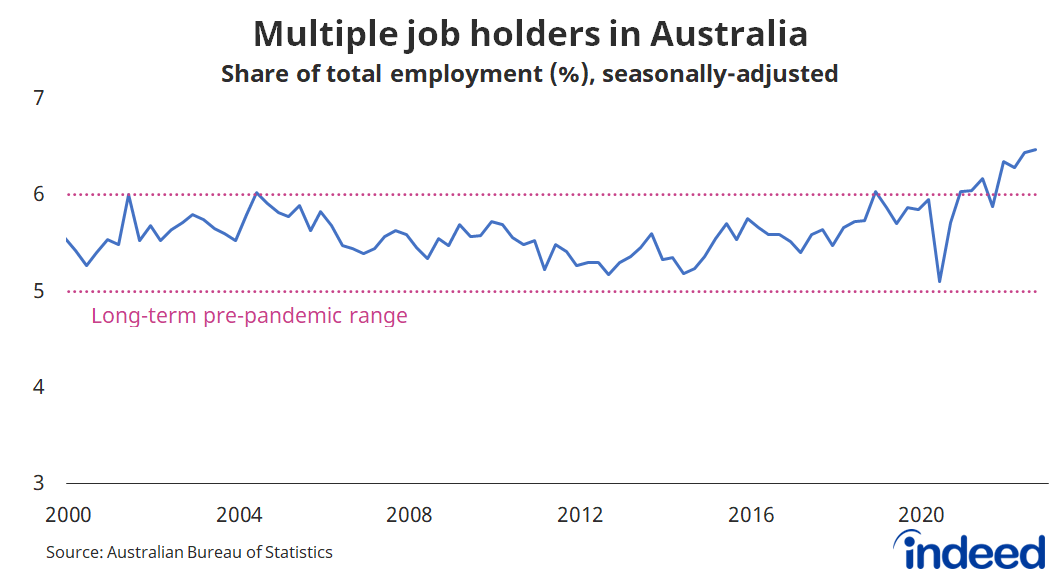
Around one in six people with a secondary job are in the healthcare & social assistance sector, primarily reflecting casual workers in aged and disability care who have jobs across multiple providers. A secondary job is also common across accommodation & food services, retail and administrative services.
Australia’s population on the road to recovery
A major factor behind Australia’s incredibly tight labour market was the nation’s closed border policy throughout 2020 and 2021. It marked Australia’s first decline in net migration since World War II and the largest decline since the first World War.
Net migration began its recovery in the December quarter last year, following the lifting of a range of economic restrictions. But it kicked it up a notch this year, with Australia’s population growing at a 1.7% annualised pace through the first half of the year, due to a record number of people entering Australia from abroad.
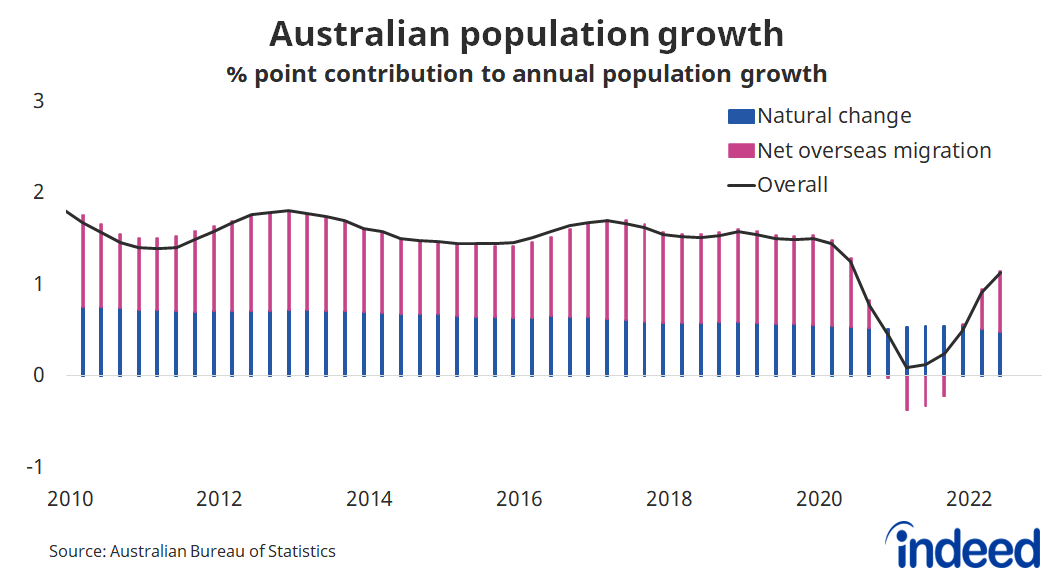
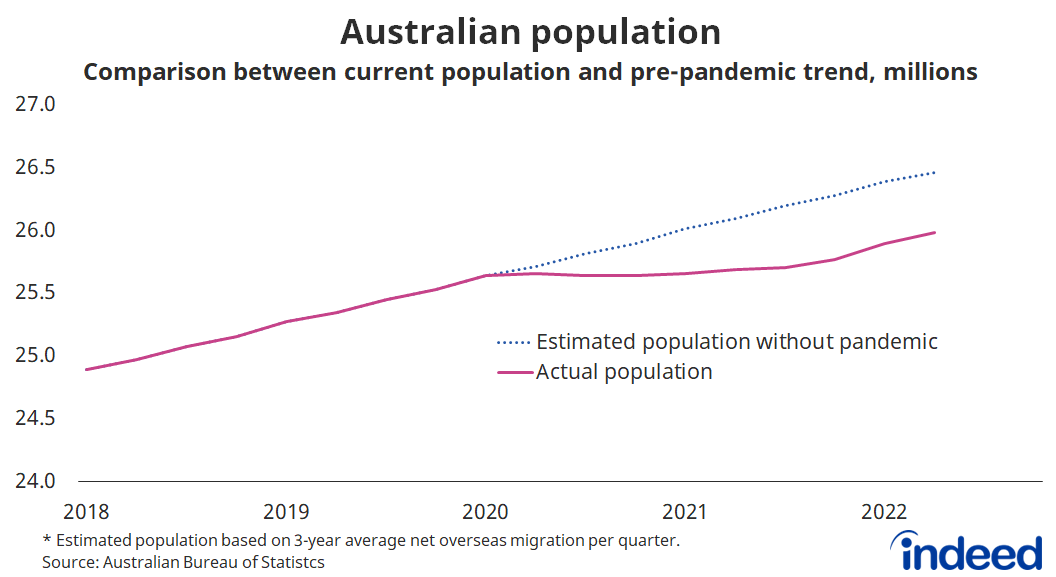
While this is a positive for Australia’s economy, labour market and recruitment, a full population recovery is unlikely in the near-term. In the absence of the pandemic, Australia’s population would be around 1.9 % — or around 480,000 people — higher than its current level. Catching up to that pre-pandemic trend would take the best part of five to ten years, assuming it happens at all.
This population shortfall has been concentrated among the under-35 crowd and has contributed to recruitment difficulties among industries that typically attract younger workers, such as accommodation & food services, retail and recreation.
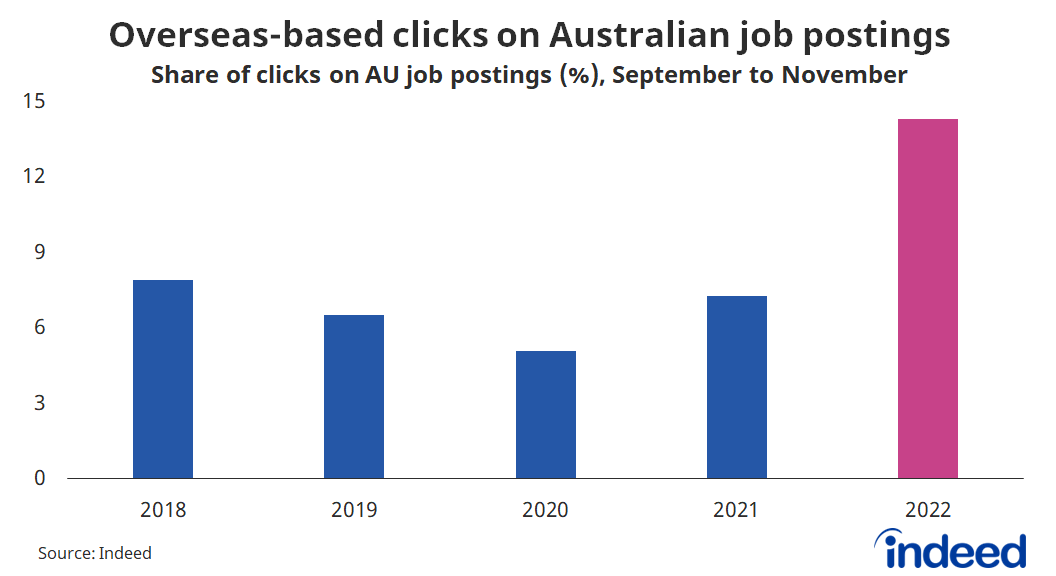
On Indeed, we tracked overseas interest in Australian jobs throughout the year. From September to November, 14.3% of clicks on Australian-based job postings came from overseas. That compares to 7.3% over the same period last year and is well above the pre-pandemic average from both 2018 and 2019.
The ramp-up in net migration and the clear interest in Australian-based job postings, puts to rest any concerns that Australia’s strict border policies have diminished its global appeal as a destination for workers. Overseas-based jobseekers are as interested in Australia as they have ever been.
Conclusion
Australia’s record-breaking labour market will come under increased pressure next year as the impact of high inflation and rising interest rates weigh heavily on household budgets. It’s hard to see how households can maintain their spending patterns — which themselves are well above pre-pandemic trends — when faced with a further decline in inflation-adjusted wages, falling asset prices and rising mortgage rates.
The industries most exposed to tighter household budgets are typically non-discretionary, such as eating out, accommodation and tourism. Households might also reduce their spending on clothing, footwear and household goods as they choose to prioritise essentials, such as food and electricity.
Despite these concerns, we enter next year with the strongest labour conditions this nation has experienced in almost a half-century. If you have to deal with a cost-of-living crisis you’d want to do it with historically low unemployment and plenty of jobs waiting to be filled. Hopefully that cushions any fallout if consumer spending softens next year.
Methodology
All posting figures in this blog post are derived from seasonally adjusted job postings. We seasonally adjust each series based on historical patterns in 2017, 2018 and 2019. Each series, including the national trend, occupational sectors and sub-national geographics is seasonally adjusted separately. We adopted this methodology in January 2021.
The national and regional analysis is based on the change in job postings on Indeed’s Australia site since February 1, 2020.
The number of job postings on Indeed.com, whether related to paid or unpaid job solicitations, is not indicative of potential revenue or earnings of Indeed, which comprises a significant percentage of the HR Technology segment of its parent company, Recruit Holdings Co., Ltd. Job posting numbers are provided for information purposes only and should not be viewed as an indicator of performance of Indeed or Recruit. Please refer to the Recruit Holdings investor relations website and regulatory filings in Japan for more detailed information on revenue generation by Recruit’s HR Technology segment.