
Key Points
- Australian job postings on Indeed recovered throughout May and by month’s end were 120% above pre-pandemic levels.
- Gains were concentrated along the east coast, with Queensland and New South Wales accounting for 60% of total posting growth.
- Job mobility in Australia is at a decade high, rising since the pandemic began in almost every age group, state and industry, thanks largely to record vacancies and greater jobseeker bargaining power.
This month’s labour market update dives deep into Australia’s increasing rate of job mobility, which has been dubbed ‘The Great Resignation.’
Australian job postings recover in May
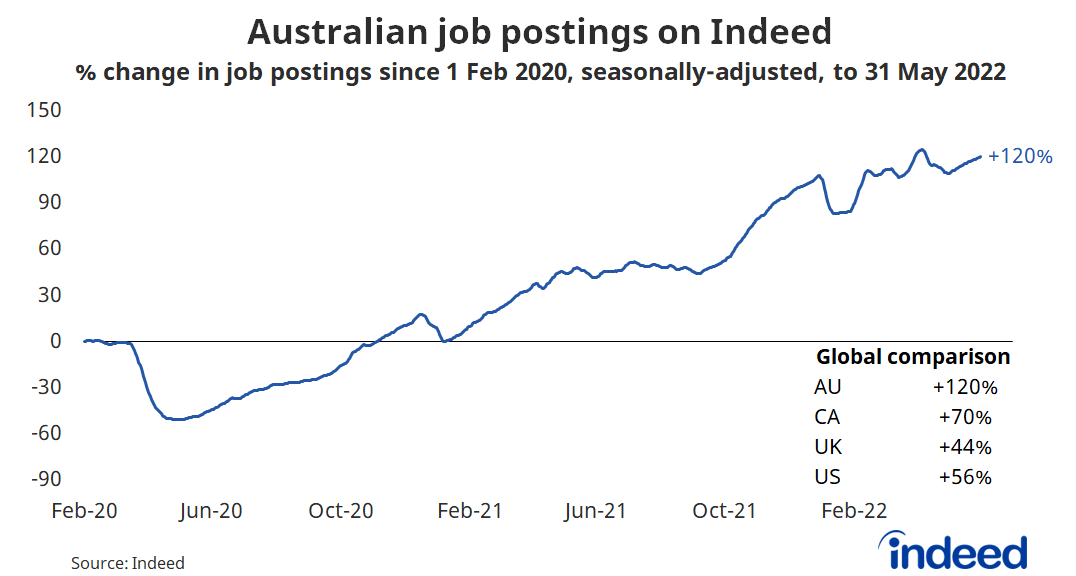
Australian job postings recovered throughout May following a decline in April related to the Easter holiday. Overall, demand for workers remains elevated, suggesting further tightening of the Australian labour market.
By the end of May, job postings were tracking 120% ahead of their level on February 1, 2020, our pre-pandemic baseline, after adjusting for seasonal trends. Postings increased 11 percentage points in May, but were still slightly below their pre-Easter peak.
Australian postings remain high by international standards, with growth well above that in the US, UK and Canada. While recruitment has been strong in each of those countries, Australia has consistently outperformed, with our recovery beginning earlier and remaining stronger despite repeated COVID-19 lockdowns.
Overall, strong postings indicate the Australian labour market will continue to tighten in the coming months. However, with the unemployment rate already at 3.9% — a 48-year low — the ability to fill some of these vacancies is a growing concern. Furthermore, rising consumer prices — associated with supply-chain disruptions and higher commodity costs — may hamper job creation over the second half of the year.
Postings gains centered in New South Wales and Victoria
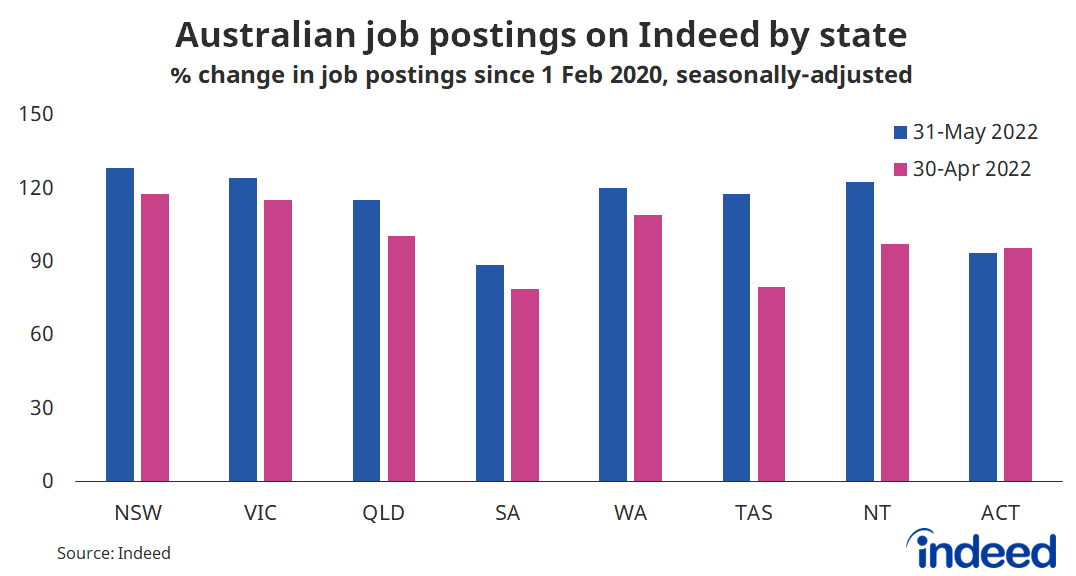
Postings growth in May was heavily concentrated on the east coast, with New South Wales and Queensland accounting for 60% of the national gain.
On May 31, postings in New South Wales were 128% above their level on February 1, 2020, up from 117% a month earlier. Victoria at 124% and Western Australia at 120% weren’t far behind. South Australia brought up the rear at 89%, but even Australia’s laggard state displayed incredibly strong growth by global standards.
Higher postings in every state and territory are consistent with a further tightening of the labour market. Currently, the unemployment rate is lowest in Western Australia at 2.9% and highest in Queensland and South Australia at 4.5%.
Demand for workers much higher in some occupations than others
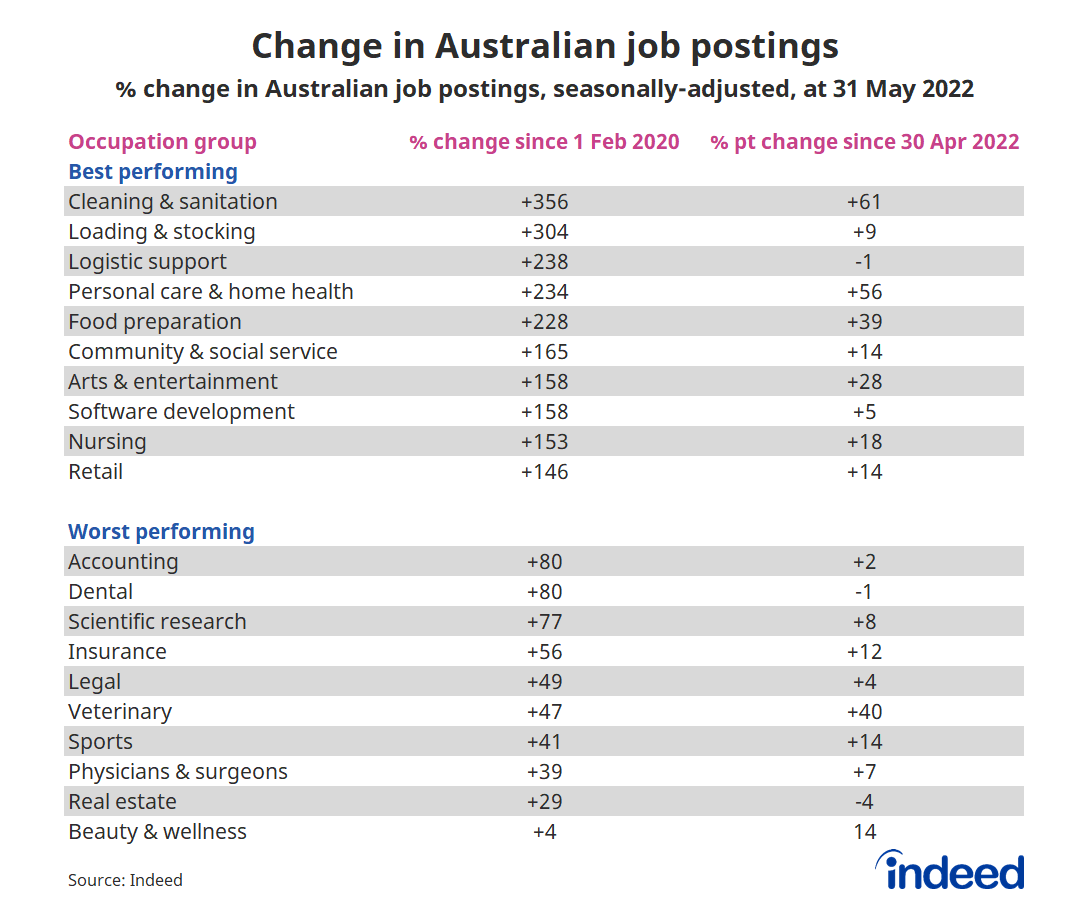
While postings for most occupational groups are well above pre-pandemic levels, growth varies considerably between the best performing and worst performing occupations.
Demand for workers in areas such as cleaning & sanitation and loading & stocking remains extraordinarily high and actually strengthened in May. Postings in these two categories were respectively 356% and 304% above their levels on February 1, 2020 — more than fourfold increases.
Sectors hit hard by economic restrictions, such as food preparation, arts & entertainment and retail, also continue to strengthen. All three are among the sectors with the strongest postings growth. However, filling some of these roles may prove difficult due to the sharp decline in Australia’s youth population.
A range of sectors continue to lag the overall jobs recovery. Growth has been slowest in beauty & wellness, up a mere 4% from February 1, 2020. It was followed by real estate, up 29%, and physicians & surgeons, with a gain of 39%. In addition, conditions in the real estate industry could deteriorate in the near term following the Reserve Bank of Australia’s moves to lift the cash rate by a cumulative 0.75 percentage point at their past two meetings.
Spotlight: Australia’s ‘Great Resignation’
The Great Resignation — the idea that workers are leaving their jobs in greater numbers, usually due to some combination of greater job opportunity or worker dissatisfaction — has been one of the most talked-about labour market trends of the past year. But what does it look like in Australia?
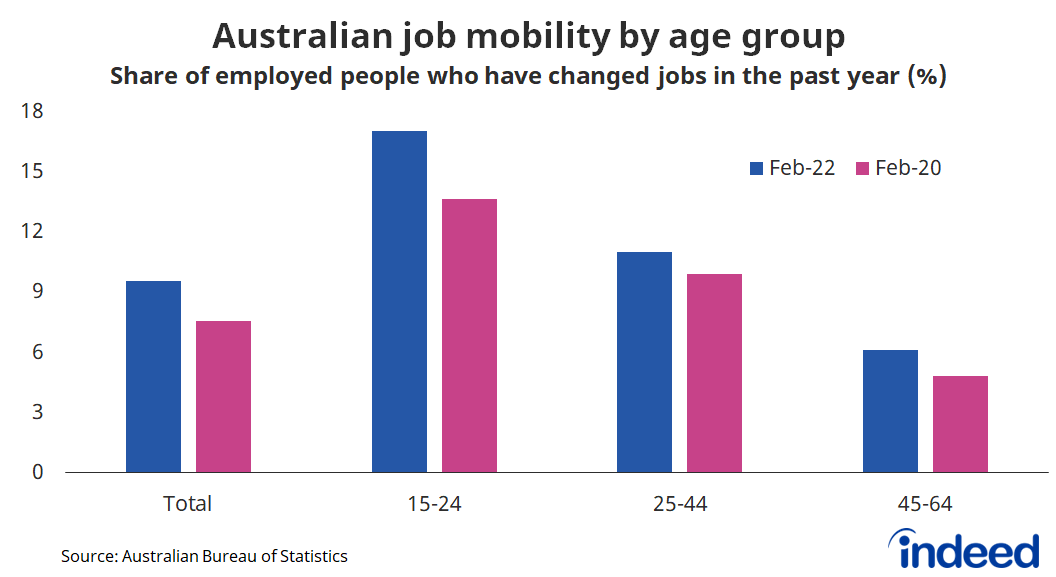
In February 2022, 9.5% of employed people had changed jobs over the past year. That’s the highest level of job mobility since 2012, up from 8.1% before the pandemic. A combination of factors are probably driving this.
For example, age seems to be important. Job mobility is much higher for younger people than for older people. In February, 17% of workers ages 15-24 changed jobs compared with 11% for those 25 to 44 and just 6.1% for the 45-64 age group. That’s understandable given younger people are more likely to work in casual or part-time employment where jobs are often temporary and job security tenuous.
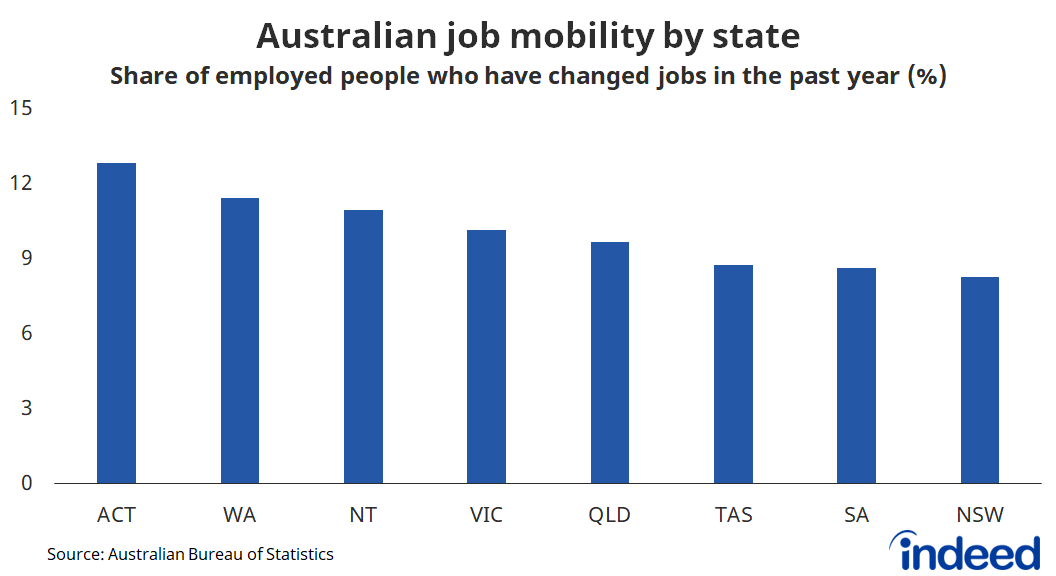
Geography is also significant. Job mobility is highest in the nation’s capital at 12.8% — perhaps reflecting the revolving door of public policy and political staff — while it is lowest in New South Wales at 8.3%. Mobility rates are probably influenced by differing sectoral and age compositions of state and territory workforces.
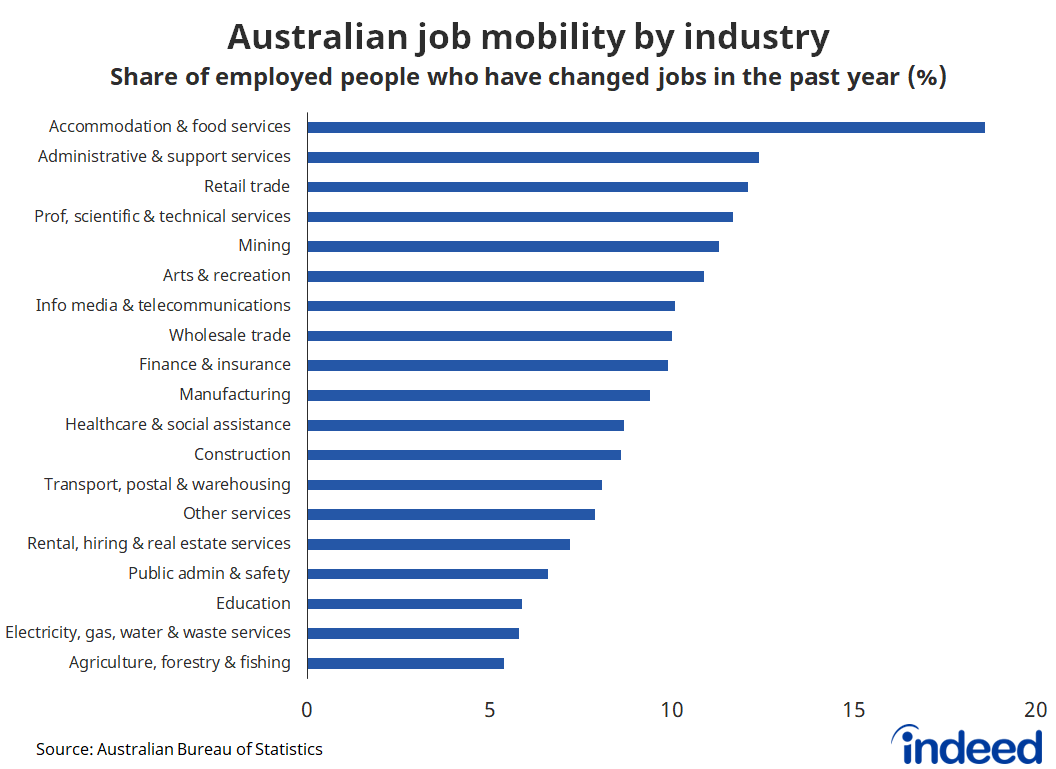
Mobility tends to be highest in youth-oriented sectors, such as accommodation & food services, retail trade and arts & recreation. An incredible 18.6% of workers in accommodation & food services changed jobs in the year ended February 2022. By contrast, mobility is lowest in agriculture, the industry with the smallest share of workers under 35. Just 5.4% of agricultural workers switched jobs during the year ended in February.
Strikingly, in February 2022, job mobility in every industry except mining was higher than a year before. The largest increase was in professional services, in which job switching jumped 4.3% percentage points. That was ahead of wholesale trade and finance, with 4.1 and 3.7 percentage point increases respectively. Mobility in the mining sector fell 0.5 percentage points.
Overall, job mobility is at its highest level in a decade, with increases registered in almost every state and industry group. Interestingly, mobility is still below what was considered normal throughout the 1990s and 2000s. The increase in mobility makes sense because the job market is more favourable for jobseekers than at any time since at least 2008. Jobseekers have greater bargaining power over where and how they work, and are better positioned to negotiate for higher wages and greater benefits.
Methodology
All posting figures in this blog post are derived from seasonally adjusted job postings. We seasonally adjust each series based on historical patterns in 2017, 2018 and 2019. Each series, including the national trend, occupational sectors and sub-national geographics is seasonally adjusted separately. We adopted this methodology in January 2021.
The national and regional analysis is based on the percentage change in job postings on Indeed’s Australia site since February 1, 2020, our pre-pandemic baseline.
The number of job postings on Indeed.com, whether related to paid or unpaid job solicitations, is not indicative of potential revenue or earnings of Indeed, which comprises a significant percentage of the HR Technology segment of its parent company, Recruit Holdings Co., Ltd. Job posting numbers are provided for information purposes only and should not be viewed as an indicator of performance of Indeed or Recruit. Please refer to the Recruit Holdings investor relations website and regulatory filings in Japan for more detailed information on revenue generation by Recruit’s HR Technology segment.
The data on job mobility come directly from the Australian Bureau of Statistics via their annual job mobility report. A change in job refers to a worker who has changed employers, but also includes workers who have been promoted or changed occupations with existing employers.