Key points:
- In the decade before the pandemic, employment grew faster in female-dominated occupations than in male-dominated ones, a trend that’s expected to continue after the health crisis.
- In that decade, employment for both men and women surged in jobs where they were the minority gender, an indication of growing workplace diversity.
- COVID-19 reduced employment in female-dominated occupations more than in male-dominated occupations, though men and women in female-dominated fields were similarly affected.
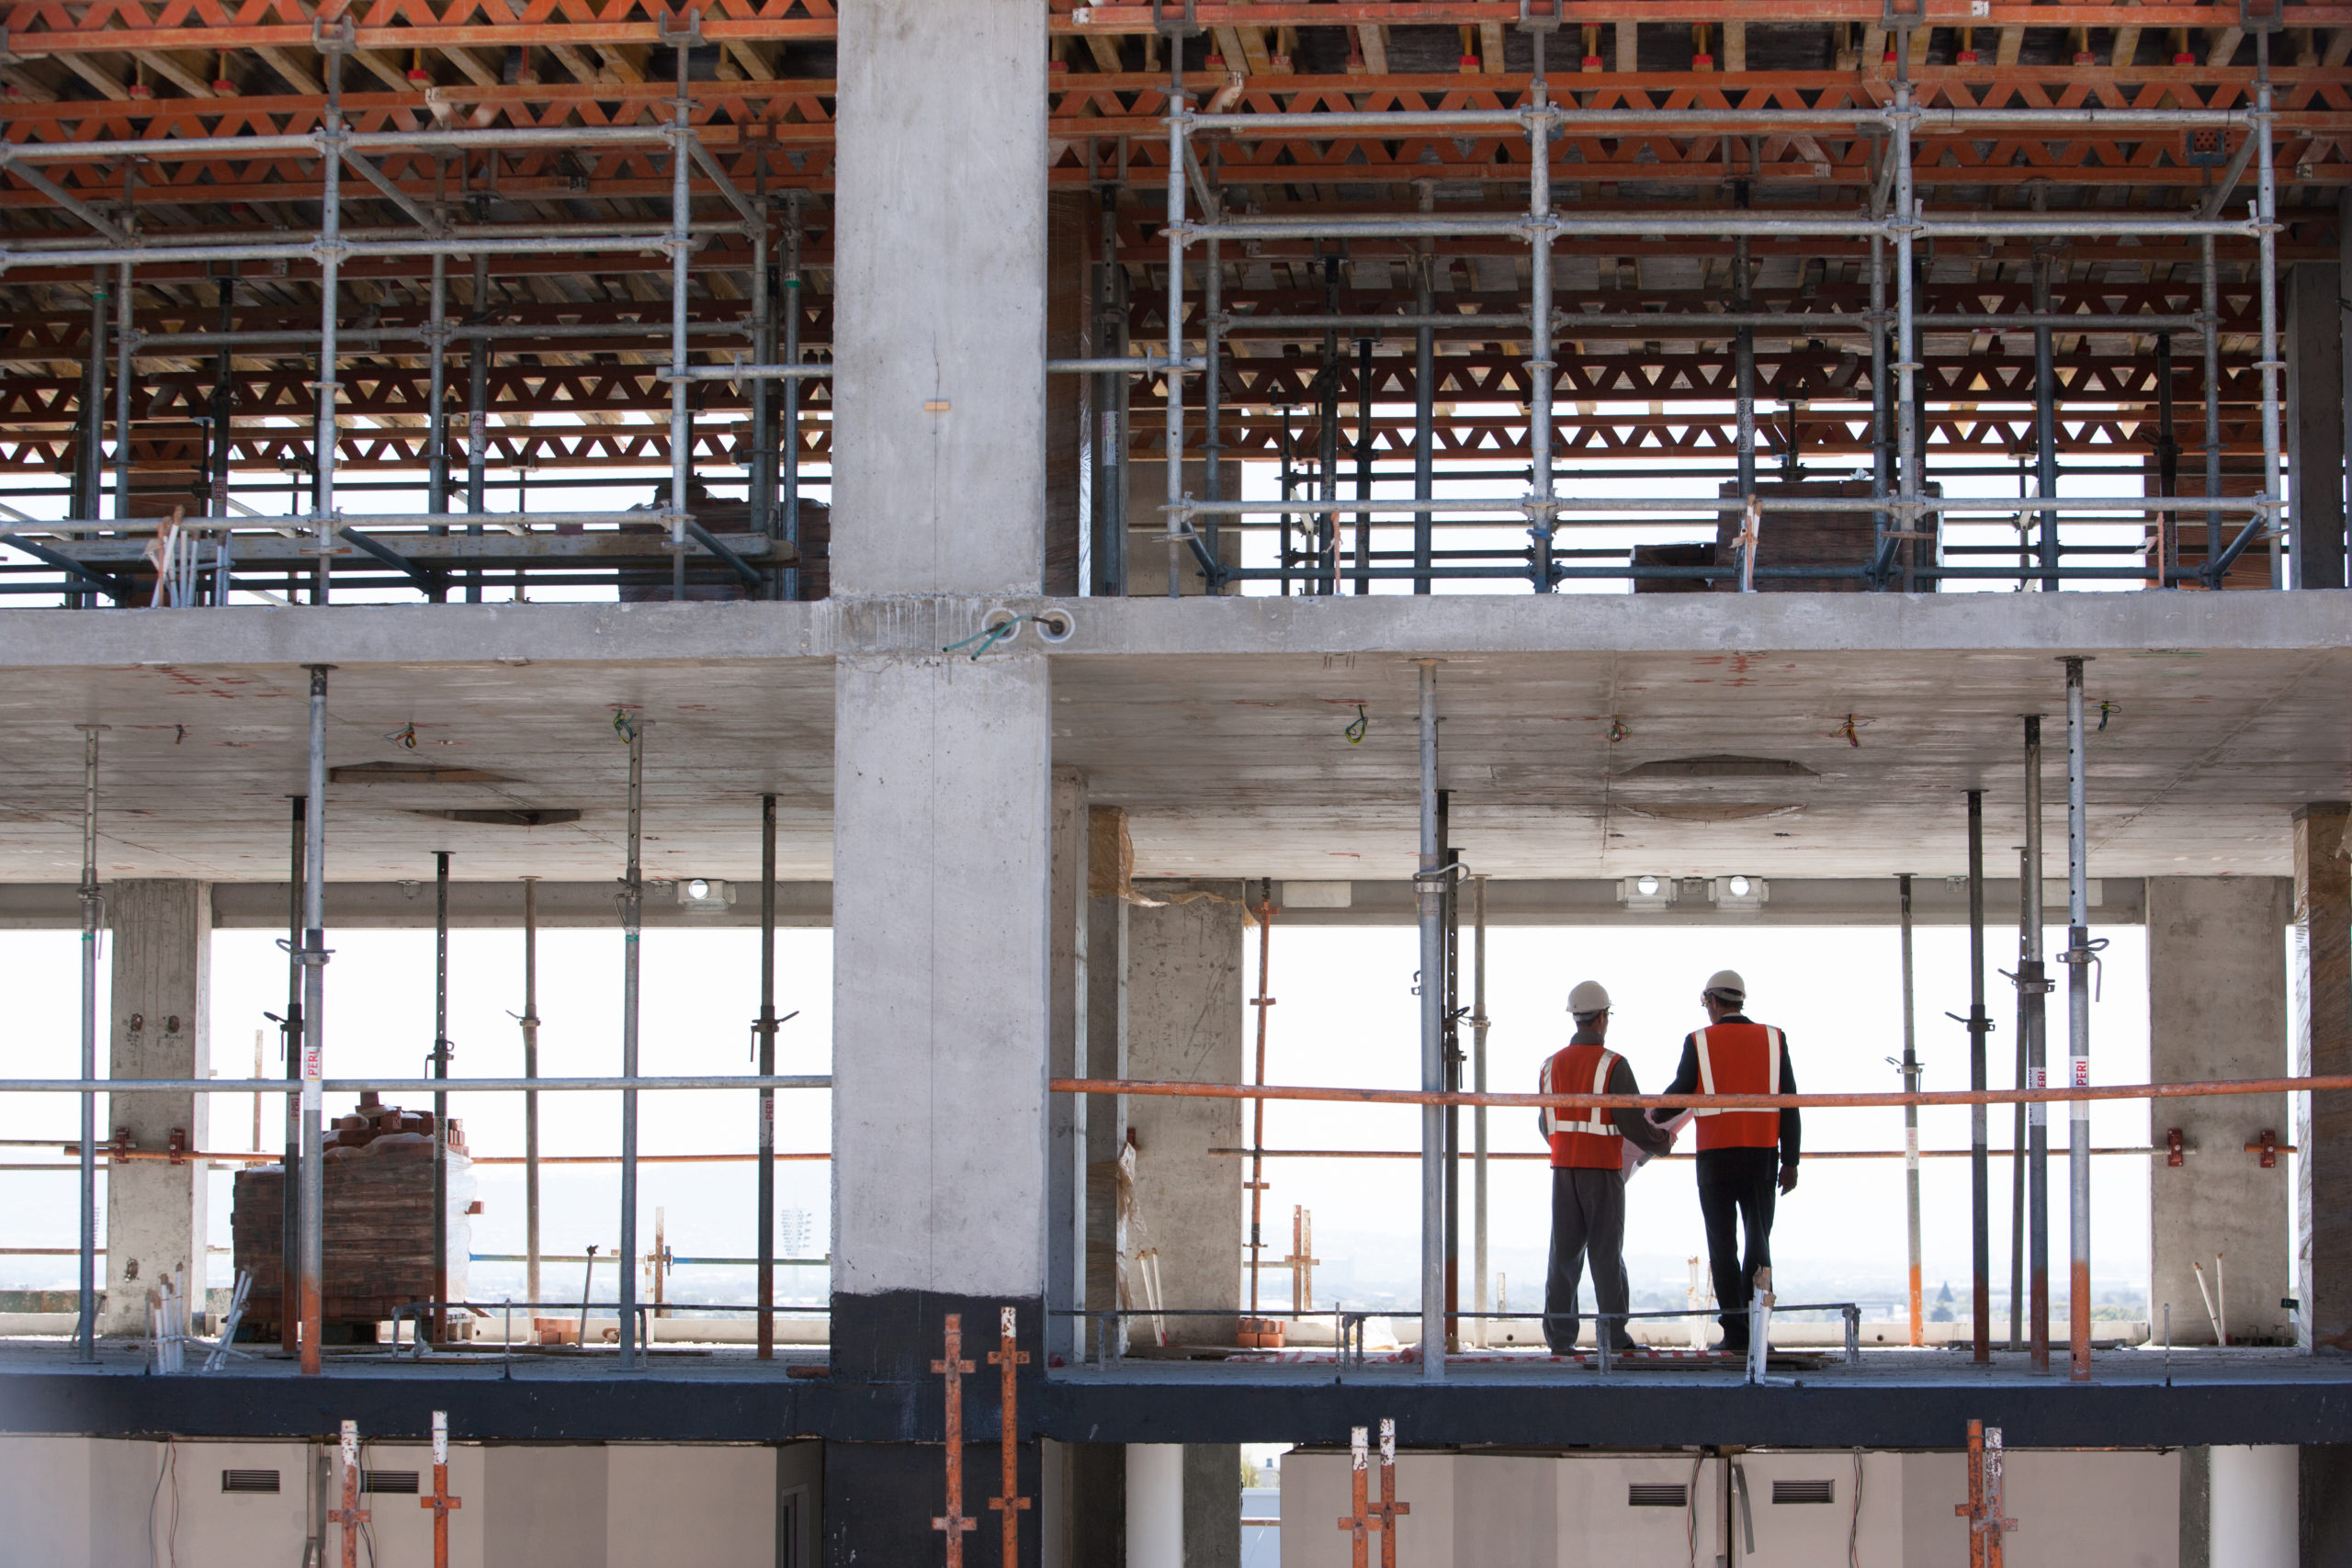
If you’re an Australian worker, there’s a good chance you work in a job surrounded largely by people of the same gender. Before the pandemic, around 44% of women and 53% of men worked in occupations where their gender accounted for at least 75% of workers.
From 2016 to 2020, around 99% of midwives, 95% of childcare workers and 83% of psychologists were women. By contrast, less than 1% of plumbers, 1.6% of electricians and 18% of software programmers were female. Women are dominant in areas such as healthcare, education and aged care, while men are overrepresented in trade occupations, engineering and tech.
Female-dominated occupations, defined as jobs where 75% or more of workers are women, grew strongly in the decade before the pandemic, outpacing the gains in fields dominated by men. Workers in female-dominated occupations like healthcare or aged care have been spoilt for choice in recent years. The same cannot be said for workers in male-dominated occupations, like manufacturing.
The impact of the pandemic on jobs has been so large and uneven that it has obscured important long-term trends. To assess the performance of male and female-dominated occupations, we looked at Australian Bureau of Statistics employment data from February 2010 to February 2020, which excludes COVID-19 effects. Separately, we examined the impact of the pandemic on gendered employment and analysed the outlook for male- and female-dominated occupations in Australia over the next five years.
Interestingly, employment prospects have improved for both men and women willing to work in jobs where they are a minority. Employment for women in male-dominated occupations, such as tech, has increased rapidly. The same is true for men in female-dominated roles, such as aged care.
Strong growth in female-dominated roles
In the decade ending February 2020, before COVID-19, employment in female-dominated occupations rose 2.8% per year compared with 1.6% for male-dominated jobs. This largely reflected strong and sustained growth in areas such as healthcare, education and aged care services, where most workers are women.
These trends are expected to continue. The latest forecast from the Department of Education, Skills and Employment projects that jobs will grow faster in female-dominated occupations than in male-dominated ones over the next five years.
Women have been the beneficiaries of Australia’s ageing population and the ongoing shift toward an economy based more on services. Just 15-years ago, as many Australians were employed in manufacturing as in healthcare and social assistance. Today, two people work in healthcare and social assistance for every worker in manufacturing.

Diversity emerging in some gender-dominated occupations
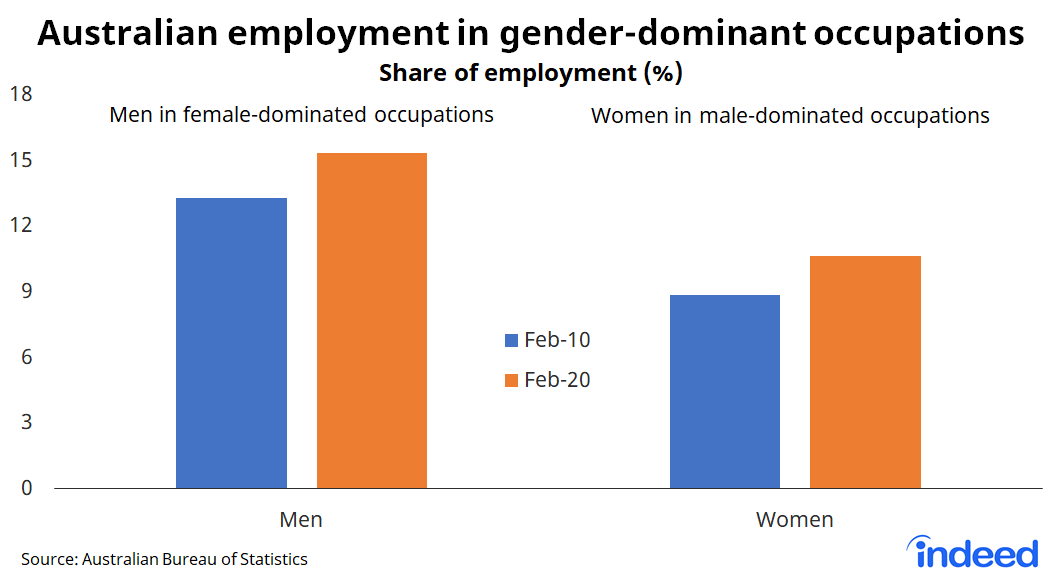
While many occupations are highly segregated, diversity is increasing. In February 2020, the employment share of women in male-dominated occupations was 10.6% compared with 8.8% a decade before, equaling 3.5% annual growth. The change has been even more pronounced for men, who accounted for 15.3% of jobs in female-dominated occupations, up from 13.2% a decade earlier, a gain of 4.3% a year.
The table below shows the occupations that have contributed most to these upward trends.
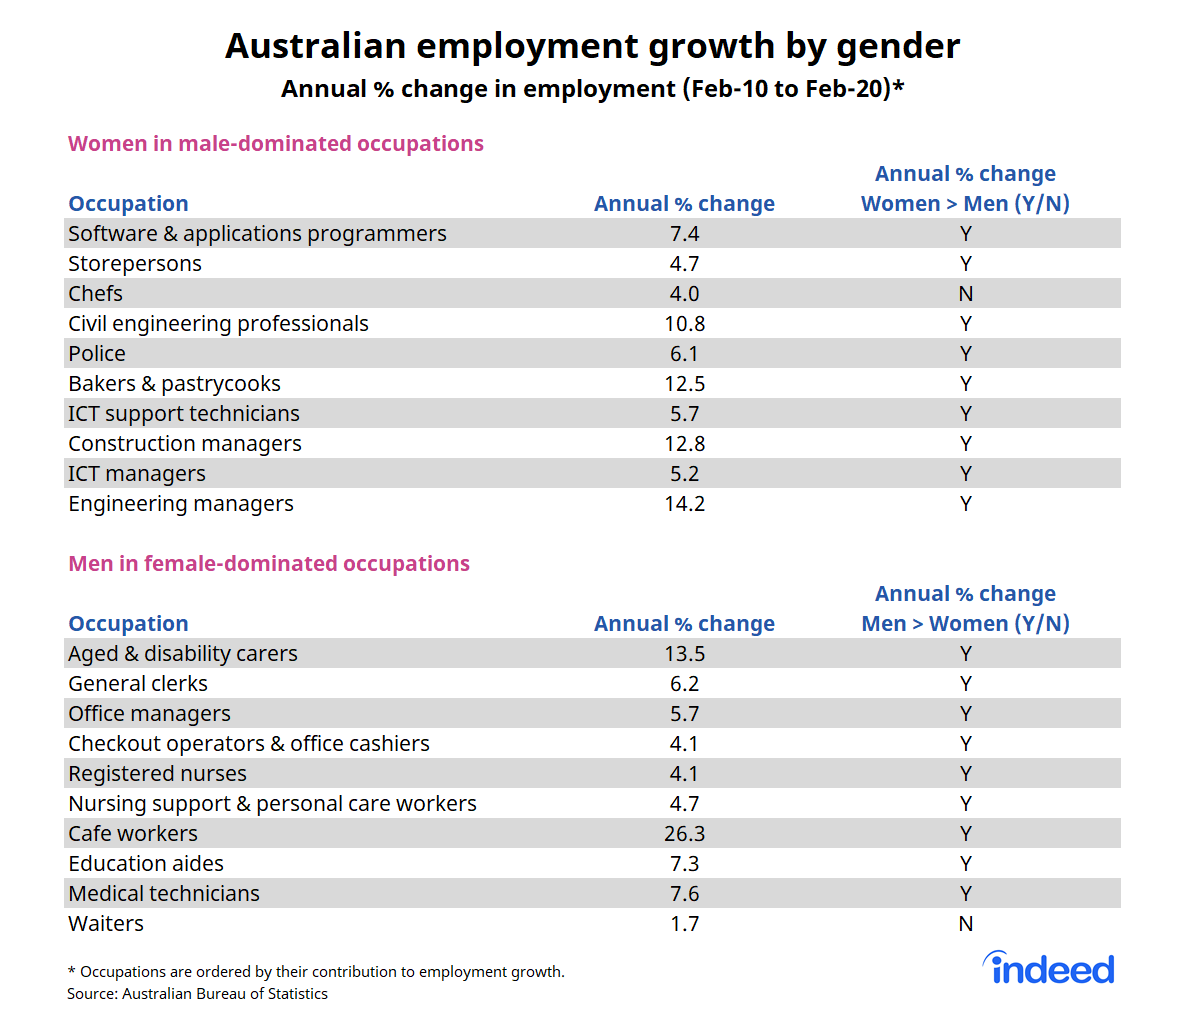
Employment for women has grown strongly across a range of male-dominated tech occupations, led by software and applications programmer. Women are also increasingly found working in factories, construction sites, restaurant kitchens, and enforcing the law. Women’s employment as software programmers increased 7.4% per year from February 2010 to February 2020, as storepersons 4.7%, as chefs 4.0% and as civil engineers 10.8%. That’s incredibly strong growth over such a long period.
Men are working more often in support roles, including care for the elderly, young people and those with disabilities or illnesses. The number of men employed as aged and disability carers increased 13.5% per year over the decade ending February 2020. Male employment also grew strongly in the occupations registered nurse, nursing support and medical technician.
For some roles, greater diversity might reflect decisions by recruiters to diversify their workforces. For example, there’s been a strong societal push to increase the number of women in senior positions. On other occasions, increasing diversity might be a response to changing demographics, the availability of talent, changing social norms, or scrutiny of earlier hiring patterns.
The impact of COVID-19
To see long-term trends clearly, we excluded COVID-19 effects by examining the decade that ended just before the pandemic hit (see methodology section below).
The pandemic has had a large impact on employment of both sexes, but the effects have been uneven across occupations. By May last year, women’s employment had fallen 7.8% compared with a 5.5% decline for men. Job losses were heavily concentrated in female-dominated occupations, down 9.7%, and mixed-female occupations, off 12.8% peak-to-trough. Jobs held up better for male-dominated and mixed-male occupations, down 3.4% and 1.6% respectively.
Within each segment, the impact on men and women was broadly similar. For example, within female-dominated and mixed-female occupations, employment for both sexes fell to similar degrees. Both experienced unprecedented job losses, followed by V-shaped recoveries in which job growth resumed strongly. For mixed-male occupations, job losses were relatively mild and trends were similar for both male and female workers.
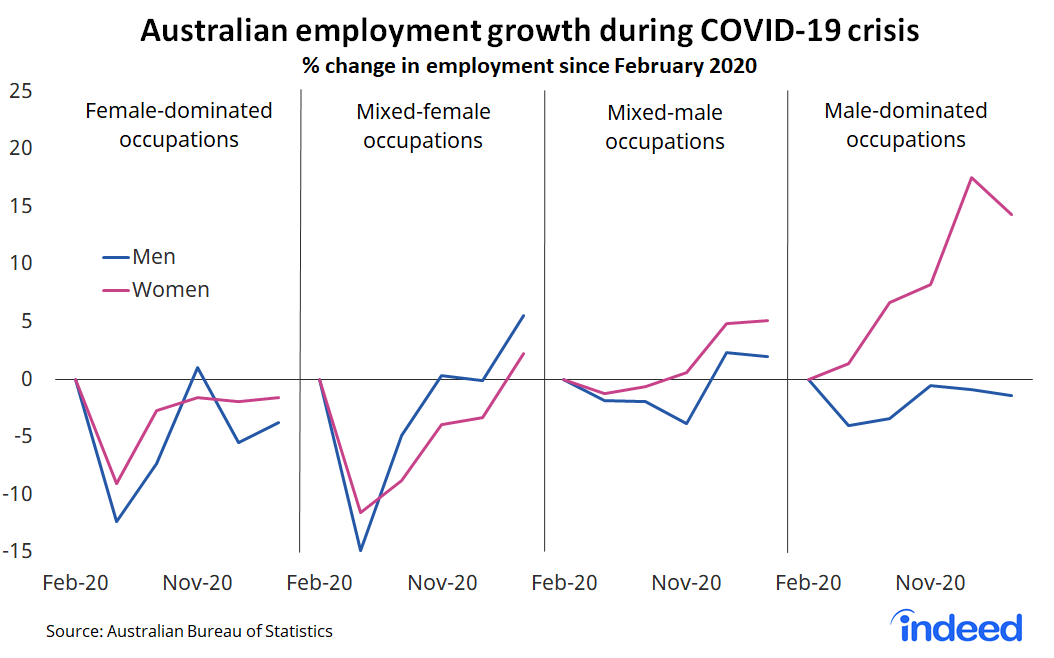
The one exception was women employed in male-dominated occupations. Among this group, COVID-19 had no impact — in fact, employment surged throughout the pandemic. This reflects the composition of women’s employment in male-dominated occupations. When women are employed in these roles, they tend to be managers or in tech or security positions, not in the blue collar jobs traditionally associated with men.
Among male-dominated occupations, on average, those with higher shares of women were more resilient during lockdowns than those with lower levels of female employment. In addition, they were more likely to be essential jobs or to be easily performed from home, and less likely to require face-to-face contact.
The jobs outlook
The trends that have shaped Australia’s labour market over the past decade are expected to persist. The Australian economy will probably continue its shift toward services, particularly the provision of health and aged care. Tech is expected to become even more central to our day-to-day lives.
In its latest five-year forecast for employment, the Department of Education, Skills and Employment projects jobs in female-dominated roles will increase 1.9% per year through November 2025. By comparison, the department expects 1.5% annual growth for mixed-female and 1.4% annual growth for both mixed-male and male-dominated occupations. To be sure, some of the strength in female-dominated roles reflects catch-up from the impact of COVID-19 on those occupations but the outlook for female-dominated roles is still bright.
These trends are especially important for young Australians yet to choose an occupation. We often make big career decisions as teenagers or young adults. If the pre-pandemic decade is any guide, young people, especially men, might benefit from thinking outside the square and pursuing a career path that runs counter to gender stereotypes.
Methodology
Female- and male-dominated roles are defined as those where 75% of workers in those occupations are one gender. Mixed-female and mixed-male roles are those where between 50% and 75% of workers are one gender. Occupations were assigned to these categories based on women’s average employment share between 2006 and 2010.
To determine long-term trends, employment in February 2020 was compared with employment in February 2010, which excludes COVID-19 effects.