
We regularly update this report to track the pandemic’s effects on the labour market.
Job postings on Indeed are a real-time measure of labour market activity. On May 21 they were tracking 45.7% ahead of their level on February 1 last year, our pre-pandemic baseline, after adjusting for seasonal trends.
From a hiring perspective, Australia hasn’t skipped a beat since JobKeeper finished on March 28.
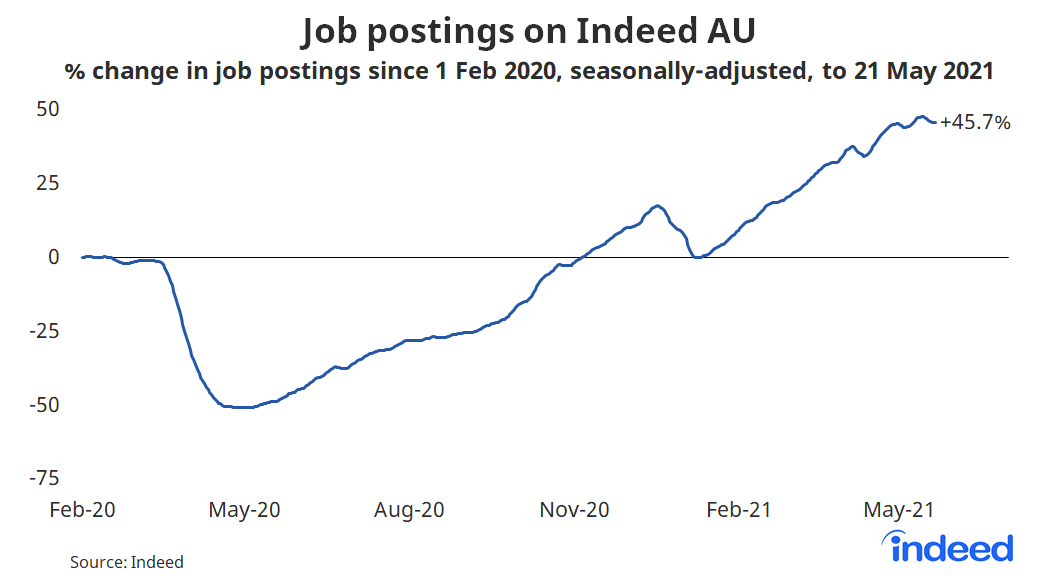
In 2020, job postings plunged from mid-March until late April, falling by half, and then gradually improved over the remainder of the year. Victoria’s lengthy second lockdown slowed the recovery, creating a temporary divergence between Victoria and the rest of Australia.
Thankfully, there appears to be no lasting impact on Victorian recruitment and short-term lockdowns in New South Wales, Western Australia and Victoria have had minimal hiring impact.
Short-term lockdowns appear likely to continue going forward due to the slower than anticipated vaccine rollout. However, provided they only last a few days we shouldn’t expect any meaningful impact on hiring trends.
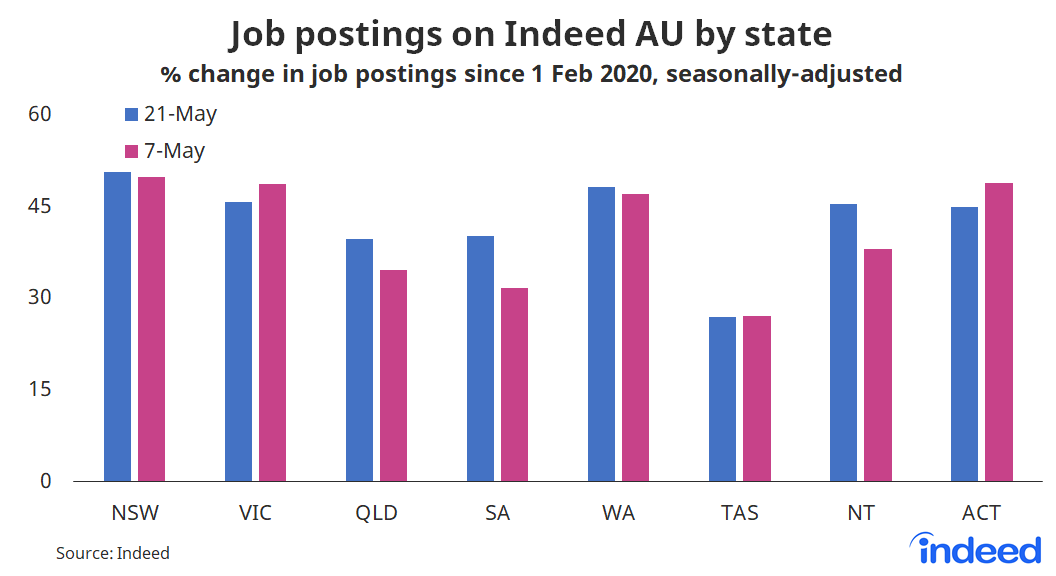
Some moderation at state level
Over the past two weeks, we have seen some stabilisation in postings among the best performing states, such as New South Wales and Western Australia. Meanwhile, there has been stronger growth in Queensland and South Australia, closing the posting gap that had emerged in recent months.
Job postings in New South Wales are around 51% above their level on February 1 last year, while Victoria is up almost 46% and Western Australia up 48%.
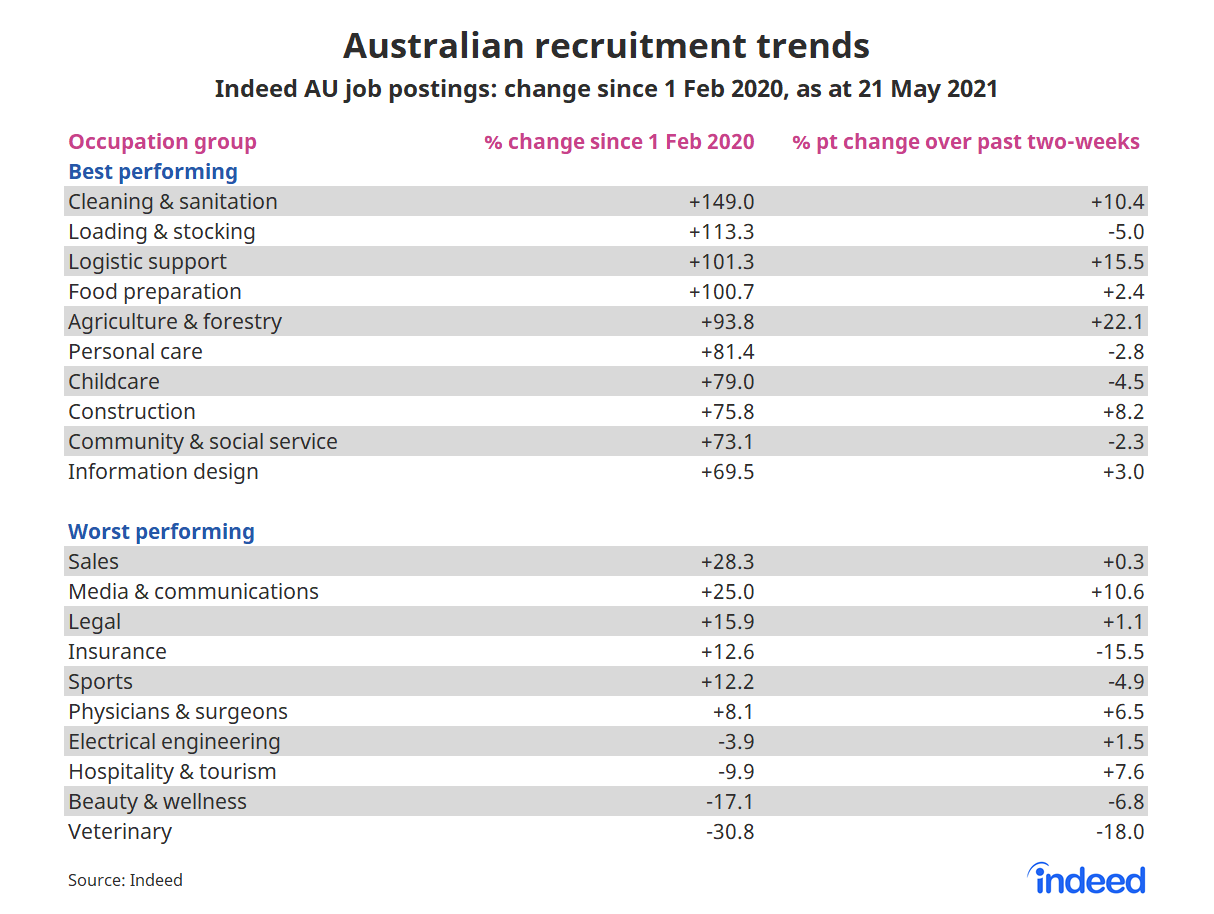
Hiring continues to improve in most occupational groups
Australia’s hiring recovery has been impressive and, although there are some occupations lagging behind, most are heading in the right direction.
Postings in four occupational groups — cleaning & sanitation, loading & stocking, logistic support and food preparation — are more than twice as high as they were before the pandemic.
Demand for workers in agriculture, personal care and childcare is also high.
Postings for most of the ‘worst performing’ occupations are now above last year’s baseline. In some cases, such as in sales or media & communications, well above pre-pandemic levels. Just four of the 50 occupations assessed had posting levels that were below their pre-pandemic baseline.
Hospitality & tourism inches closer to positive territory, now down 9.9% compared to February 1 last year, an improvement of 7.6% points in the past fortnight. Postings for both veterinary and beauty & wellness remain weak, having declined further recently.
From a hiring perspective, Australia appears to have successfully navigated the end of the JobKeeper wage subsidy. That’s a significant milestone on the path to full economic recovery. Overall job postings remain at a high level, showing some signs of stabilisation, which points towards further employment gains in coming months.
Methodology
All figures in this blogpost are the percentage change in seasonally-adjusted job postings since February 1, 2020, using a seven-day trailing average. February 1 last year is our pre-pandemic baseline. We seasonally adjust each series based on historical patterns in 2017, 2018, and 2019. Each series, including the national trend, occupational sectors, and sub-national geographies, is seasonally adjusted separately.
We adopted this new methodology in January 2021 and now use it to report all historical data. Historical numbers have been revised and may differ significantly from originally reported values. The new methodology applies a detrended seasonal adjustment factor to the percentage change in job postings. In contrast, our previous methodology used the 2019 change between February 1 and the reported date as the adjustment factor, which implicitly included both a seasonality component and the underlying trend.
The number of job postings on Indeed.com, whether related to paid or unpaid job solicitations, is not indicative of potential revenue or earnings of Indeed, which comprises a significant percentage of the HR Technology segment of its parent company, Recruit Holdings Co., Ltd. Job posting numbers are provided for information purposes only and should not be viewed as an indicator of performance of Indeed or Recruit. Please refer to the Recruit Holdings investor relations website and regulatory filings in Japan for more detailed information on revenue generation by Recruit’s HR Technology segment.