We regularly update this report to track the pandemic’s effects on the labour market. Our methodology changed at the start of 2021, as explained in the methodology note at the end of the post.
Job postings on Indeed are a real-time measure of labour market activity. On February 26 they were tracking 19.8% ahead of their level on February 1 last year, our pre-pandemic baseline, after adjusting for seasonal trends.
Postings have improved throughout the month of February, with postings up from +14.7% a fortnight ago and +9.2% at the end of January.
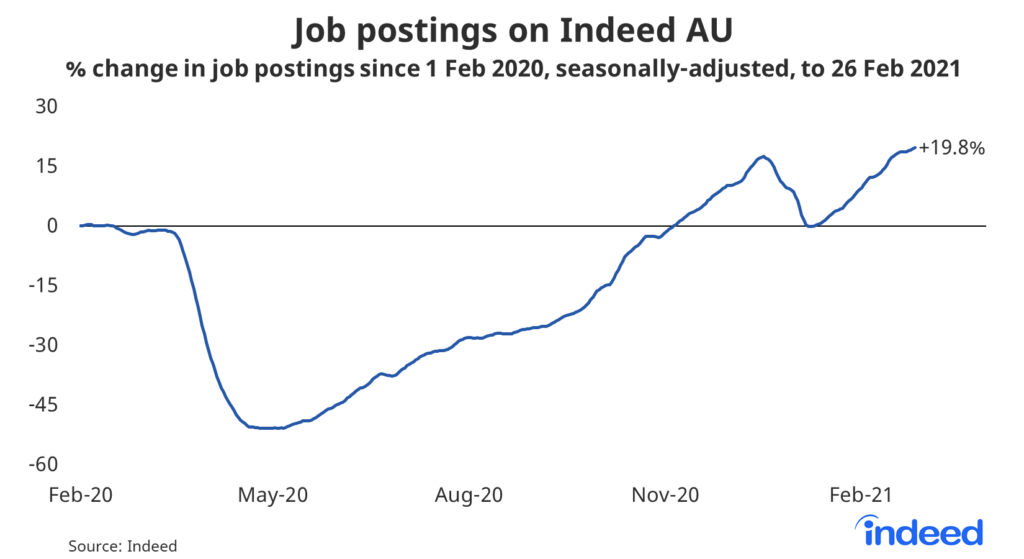
In 2020, job postings plunged from mid-March until late April, falling by half, and then gradually improved over the remainder of the year. Victoria’s lengthy second lockdown slowed the recovery, creating a temporary divergence between Victoria and the rest of Australia. Thankfully, there appears to be no lasting impact on Victorian recruitment and short-term lockdowns in New South Wales, Western Australia and Victoria have had minimal hiring impact.
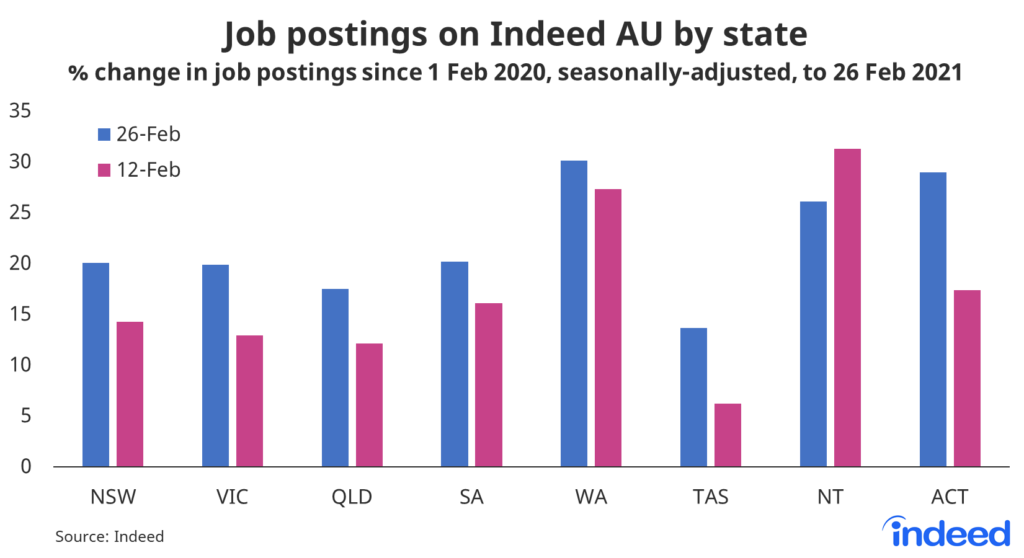
In the past two-weeks, job postings have continued to improve across every state and territory, besides the Northern Territory.
Compared with last year’s baseline, postings are up 20% in New South Wales, Victoria and South Australia. They are also up 17.5% in Queensland. Western Australia is tracking the strongest, up 30% compared with last year’s baseline, with the nation’s capital not far behind.
Hiring continues to improve in most occupational groups
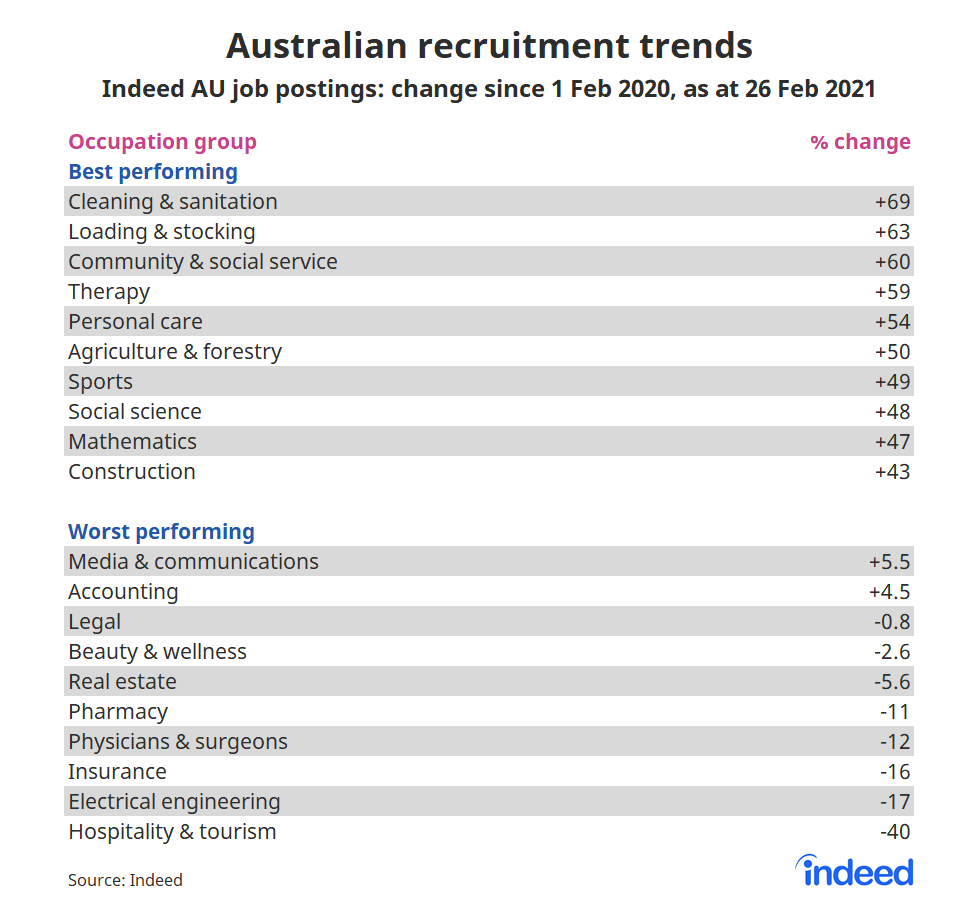
While Australia’s hiring recovery has been impressive, outpacing other countries, it is also uneven. Some occupation groups are thriving, while a handful continue to suffer.
Job postings for cleaning & sanitation roles are up 69% compared with their baseline on February 1 last year. Postings for loading & stocking and community & social service are up 63% and 60%, respectively.
Jobs in agriculture continue to improve, recovering from 2020’s horrendous bushfire season. While sports hiring has improved considerably ahead of the AFL and rugby league season launches.
The impact of COVID-19 remains largest in hospitality & tourism. Job postings for hospitality are still down 40% compared to their baseline. Many restaurants continue to operate below capacity, with temporary lockdowns and restrictions on travel hurting the bottom line.
Australia’s hiring has picked up to such a degree, that even some of the ‘worst performing’ occupation groups have job postings that are higher than their level pre-crisis. There is also cause for optimism among some of the weaker occupations. For example, real estate hiring will surely improve on the back of rising property prices.
Australia’s hiring recovery gathered pace throughout February. It’s also broadened, with hiring in an increased share of occupational groups above last year’s baseline. Hospitality & tourism remains a clear outlier, with hiring languishing well behind other areas of the Australian economy.
Methodology
All figures in this blogpost are the percentage change in seasonally-adjusted job postings since February 1, 2020, using a seven-day trailing average. February 1 last year is our pre-pandemic baseline. We seasonally adjust each series based on historical patterns in 2017, 2018, and 2019. Each series, including the national trend, occupational sectors, and sub-national geographies, is seasonally adjusted separately.
We adopted this new methodology in January 2021 and now use it to report all historical data. Historical numbers have been revised and may differ significantly from originally reported values. The new methodology applies a detrended seasonal adjustment factor to the percentage change in job postings. In contrast, our previous methodology used the 2019 change between February 1 and the reported date as the adjustment factor, which implicitly included both a seasonality component and the underlying trend.
The number of job postings on Indeed.com, whether related to paid or unpaid job solicitations, is not indicative of potential revenue or earnings of Indeed, which comprises a significant percentage of the HR Technology segment of its parent company, Recruit Holdings Co., Ltd. Job posting numbers are provided for information purposes only and should not be viewed as an indicator of performance of Indeed or Recruit. Please refer to the Recruit Holdings investor relations website and regulatory filings in Japan for more detailed information on revenue generation by Recruit’s HR Technology segment.