
Key points:
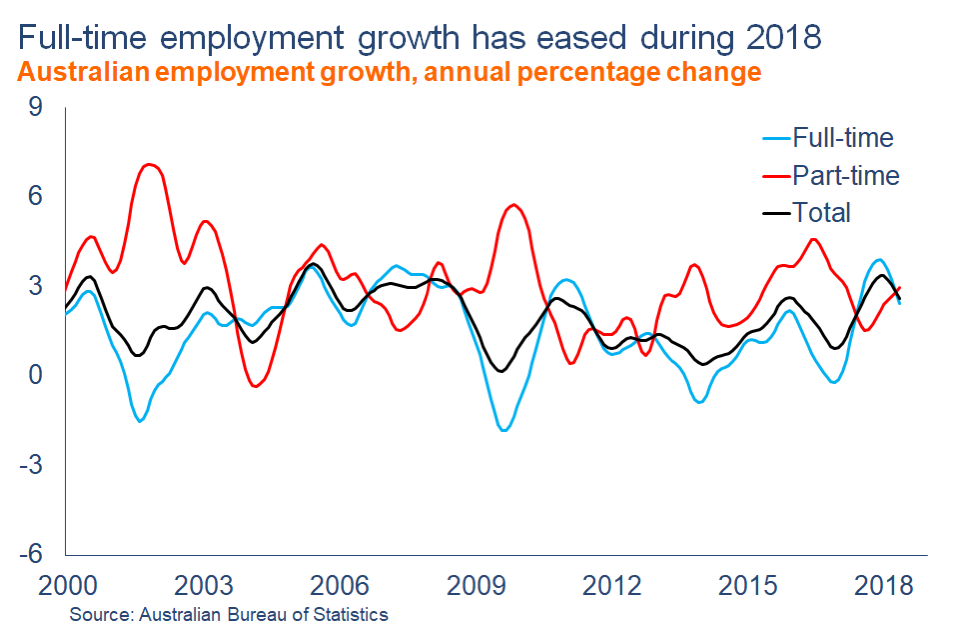
- Employment growth in 2018 has eased considerably compared with last year, with full-time jobs accounting for less than one-third of the gain compared with 80% in 2017.
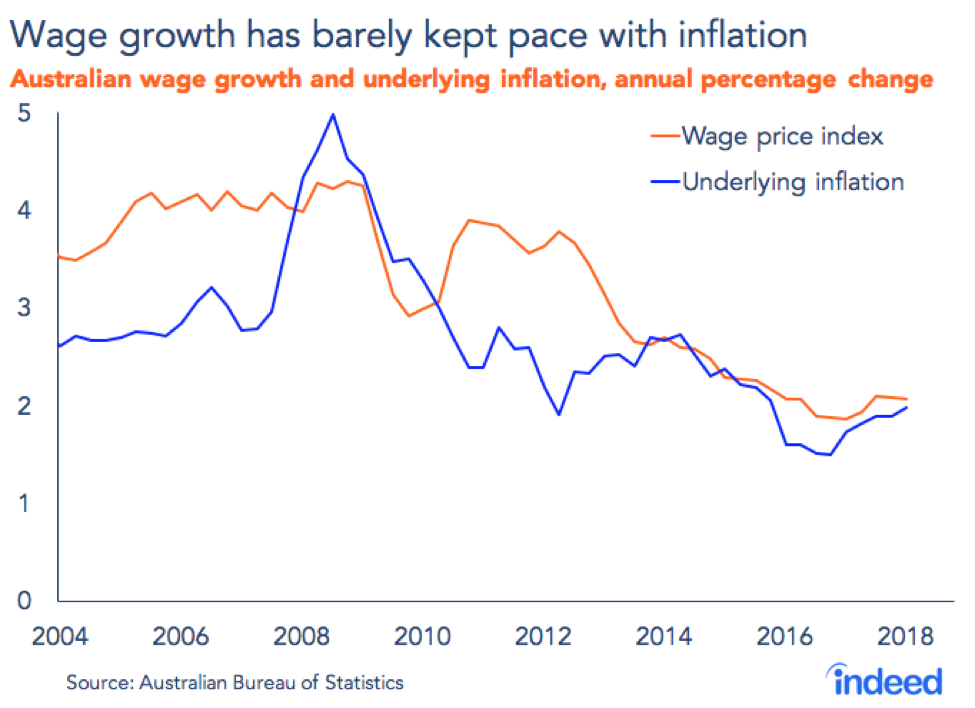
- Wage growth remains near record lows, with every state and industry underperforming. However, tax cuts and a boost to the minimum wage will give households some relief over the remainder of the year.
- Manufacturing has accounted for almost 60% of employment growth over the past six months, bucking a long-term downward trend.
In 2018, employment growth has eased considerably, albeit still posting solid gains, while wage growth continued to disappoint. Employment has increased 20,600 people per month this year, almost 40% lower than the rate of job creation in 2017. What is more, the quality of jobs created has declined, with less than one-third full-time positions.
Amid softer employment growth, tepid wage growth is the predominant issue. It’s been five years since Australia last experienced a sizable jump in wages and, despite policymakers best efforts, signs of improvement are few. Low wage growth has now emerged as a key issue in the next federal election, with the national government outlining an ambitious series of personal tax cuts in the 2018-19 budget.
Labour market slack remains high
While employment growth has been solid in 2018, conditions have taken a clear backwards step following a remarkably strong run last year. In the first half of 2018, employment increased at an annualised pace of 2%, compared with 3.3% during 2017. The driving trend has been much softer growth in full-time positions. Expansion of part-time employment actually strengthened through the first half of 2018 compared with last year. Although the data can be volatile and some pullback was expected–Australia isn’t big enough to sustain the full-time job growth that occurred last year–the shift has been swift and will be watched closely by policymakers.
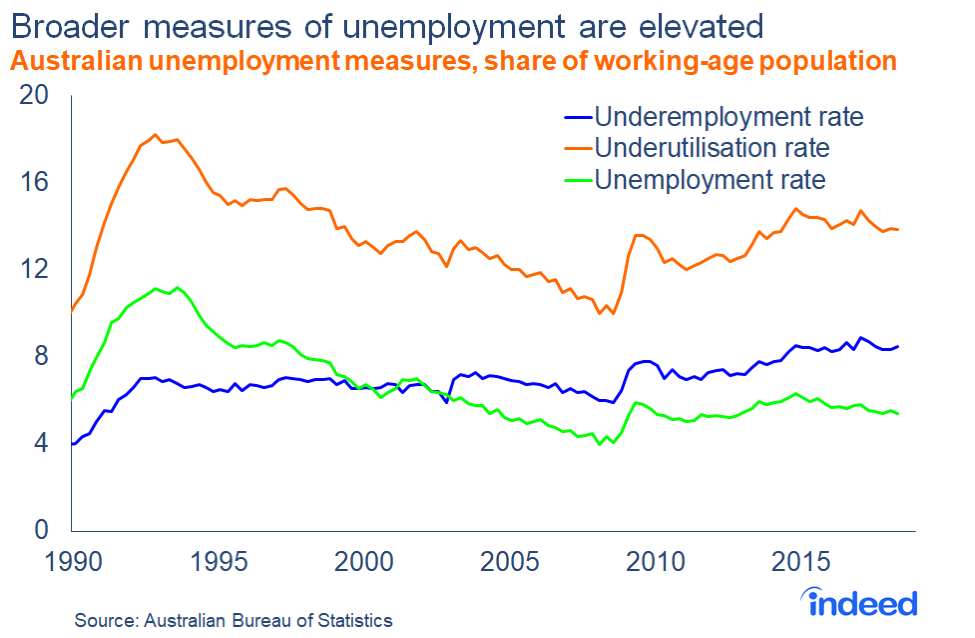
Consistent with employment growth, the unemployment rate has eased to 5.4%. In isolation, a 5.4% unemployment rate sounds pretty good. Since 1990, the rate has been above its current level around three-quarters of the time. But the increasing prevalence of part-time work in Australia suggests that the unemployment rate is no longer the best indicator of labour market health.
Broader measures of unemployment, such as the underemployment and underutilisation rates, paint a very different picture. The underemployment rate, which measures people who are working but want more hours, sits at 8.5%. Meanwhile, the underutilisation rate, which includes both unemployed and underemployed people, remains stuck at almost 14%. To put these figures in perspective, the underemployment rate has been higher than its current level just 4.4% of the time since 1990. The underutilisation rate has been higher 42% of the time, pointing to considerable labour slack across the Australian economy.
Manufacturing is driving employment growth
The news isn’t all bad though. The number of job vacancies continues to rise–up 21% over the past year–which indicates the Australian business sector continues to create new opportunities. The number of unemployed people per job vacancy is now at its lowest level since the beginning of the global financial crisis.
In an odd turn, manufacturing has become the leading source of employment growth. Manufacturing employment has accounted for almost 60% of employment gains over the past six months. The Australian Industry Group’s manufacturing performance index has been in positive territory for the past 21 months, fueling demand for labourers and machinery operators. Over the past six months, those two occupations have accounted for almost half the rise in manufacturing employment.
Indeed job posting trends have tended to align themselves with these data. A variety of blue-collar occupations, including industry machinery mechanics and heavy equipment mechanics, have been among the fastest growing roles this year, with their share of total job postings up 79% and 55% respectively over the first half of 2018. Boilermaker postings have increased their share by 50%.
At the same time, many occupations have seen a sharp decline in the number of opportunities. Diagnostic medical sonographers, social workers and a range of other health professions have posted some of the biggest drops. Registered nurses have recorded a 29% decline in share of total job postings this year after finishing as the top-ranked occupation for job postings last year. The sheer number of opportunities available last year suggested that demand for nurses might ease a little in the near term. Nevertheless, we believe this is a short-term phenomenon. Strong demand for healthcare services will continue to create opportunities for nurses across the country.

Wage growth continue to disappoint
Low wage growth has emerged as the key economic issue facing Australia. Over the past five years, wage growth has barely kept pace with inflation. If anything, wage conditions appear to have softened further in the first half of 2018.
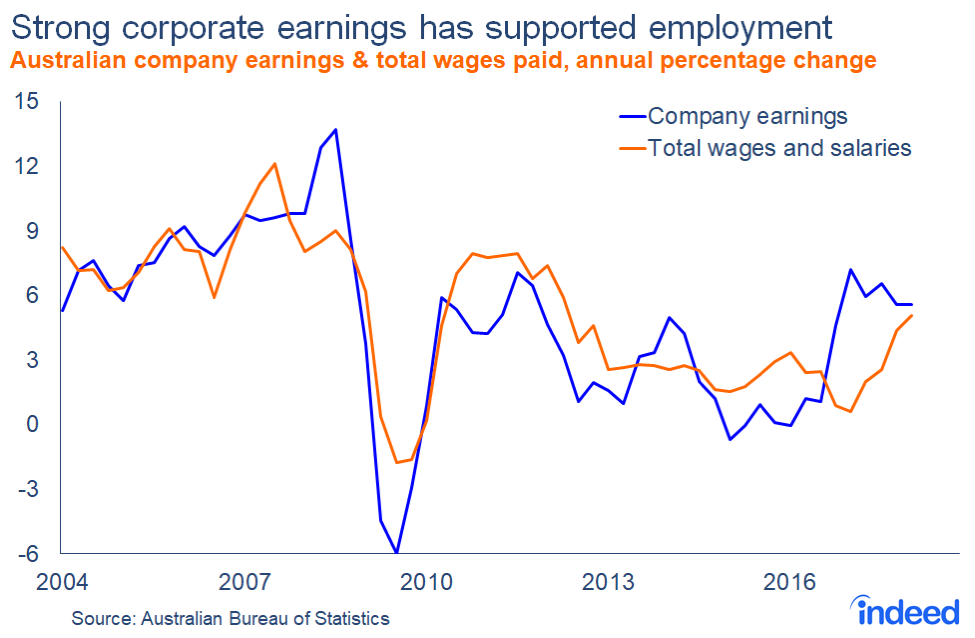
Nevertheless, there is cause for optimism on wages. Some firms are reporting greater difficulty finding suitable staff, reflecting tighter conditions in some occupations. Australian employers are also well placed to pay their staff more. Corporate earnings have been growing strongly for the past 18 months. More recently, those gains have found their way to employees, albeit via a greater willingness to hire rather than boost wages.
The latest job market developments offer low-income earners both good news and bad news. On July 1, the minimum wage rose 3.5%, benefiting up to 2.3 million workers. Yet, on the same day, between 200,000 and 400,000 workers across the hospitality, retail trade and fast-food sectors had their penalty rates cut. That means some workers got a pay rise and pay cut in the same week. But, by virtue of reaching more people, the minimum wage increase should more than offset the effect of lower penalty rates, contributing to modest wage growth in the second half of the year.
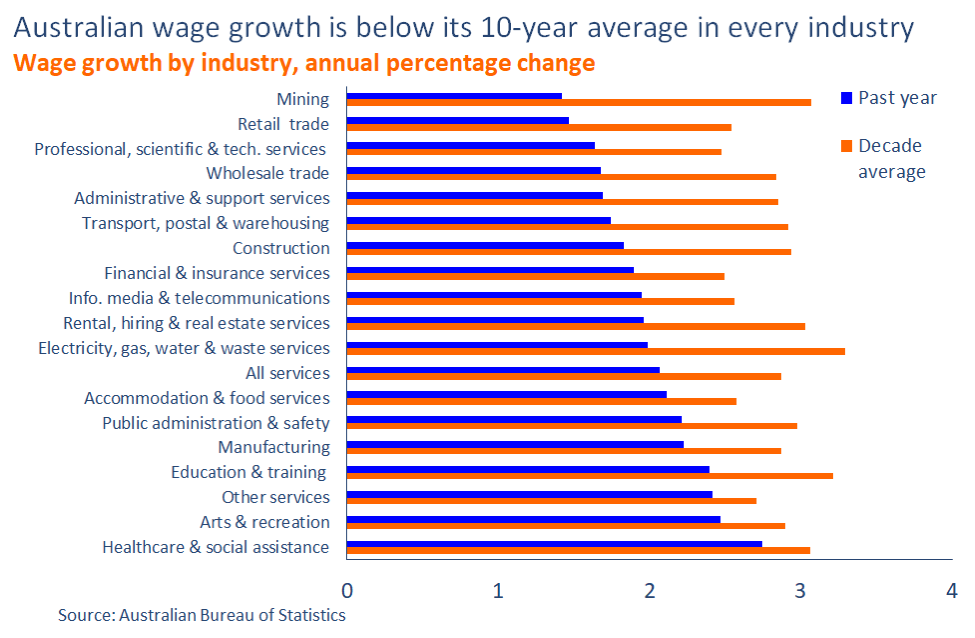
It’s easy to understand why wage growth is causing so much concern. Feeble wage gains have persisted for over five years, and no state or industry has been spared. In the mining sector, wage growth is a full 54% below its average over the decade, while in retail trade and wholesale trade the declines are 42% and 41% respectively. Wage growth in healthcare, Australia’s best-performing industry, is still 10% below its decade average.
Tax cuts for households
On May 8, the federal government announced a series of tax cuts that will flatten Australia’s progressive income tax system, removing the second top tax bracket of 37%. The new tax regime will place everyone earning between $40,001 and $200,000 into the same marginal bracket, marking the most dramatic change in Australia’s tax system since the introduction of the goods and services tax (GST) in 2000.
The cuts, to be introduced in three phases over the next seven years, will primarily benefit lower- and middle-income earners initially. But later phases will overwhelmingly benefit higher-income earners. Examples are included in the table below.
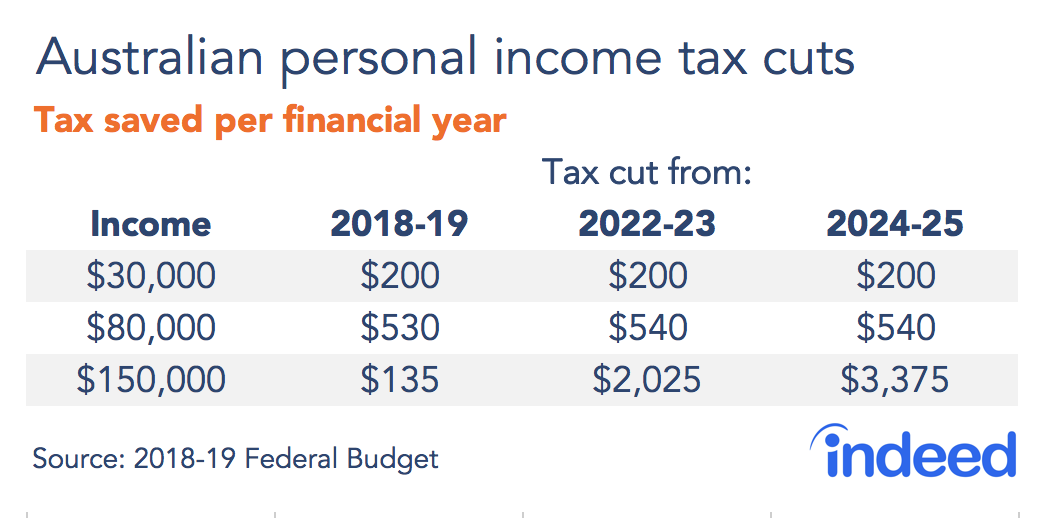
Wages are calculated pre-tax, so tax cuts don’t affect them directly. But the cuts will increase a household’s disposable income and purchasing power, allowing people to spend and save more than they otherwise could. Someone earning $30,000 a year effectively received a 0.7% pay raise beginning 1 July. By comparison, a person earning $150,000 a year gets little in 2018-19, but will collect a 2.3% bonus in the third phase starting 1 July 2024.
The immediate impact of these tax cuts is expected to be small, largely because the phase one cuts are relatively modest. Still, by targeting lower- and middle-income earners, most recipients will spend rather than save their additional after-tax income. We anticipate these measures will support economic growth in the near term, creating a small number of new jobs, which may lead to modest employment growth gains in the second half of 2018.
Nevertheless, with labour market slack still elevated, these measures are unlikely to contribute materially to near-term wage growth. Unfortunately, workers across the country can expect feeble income growth to continue.