Key points:
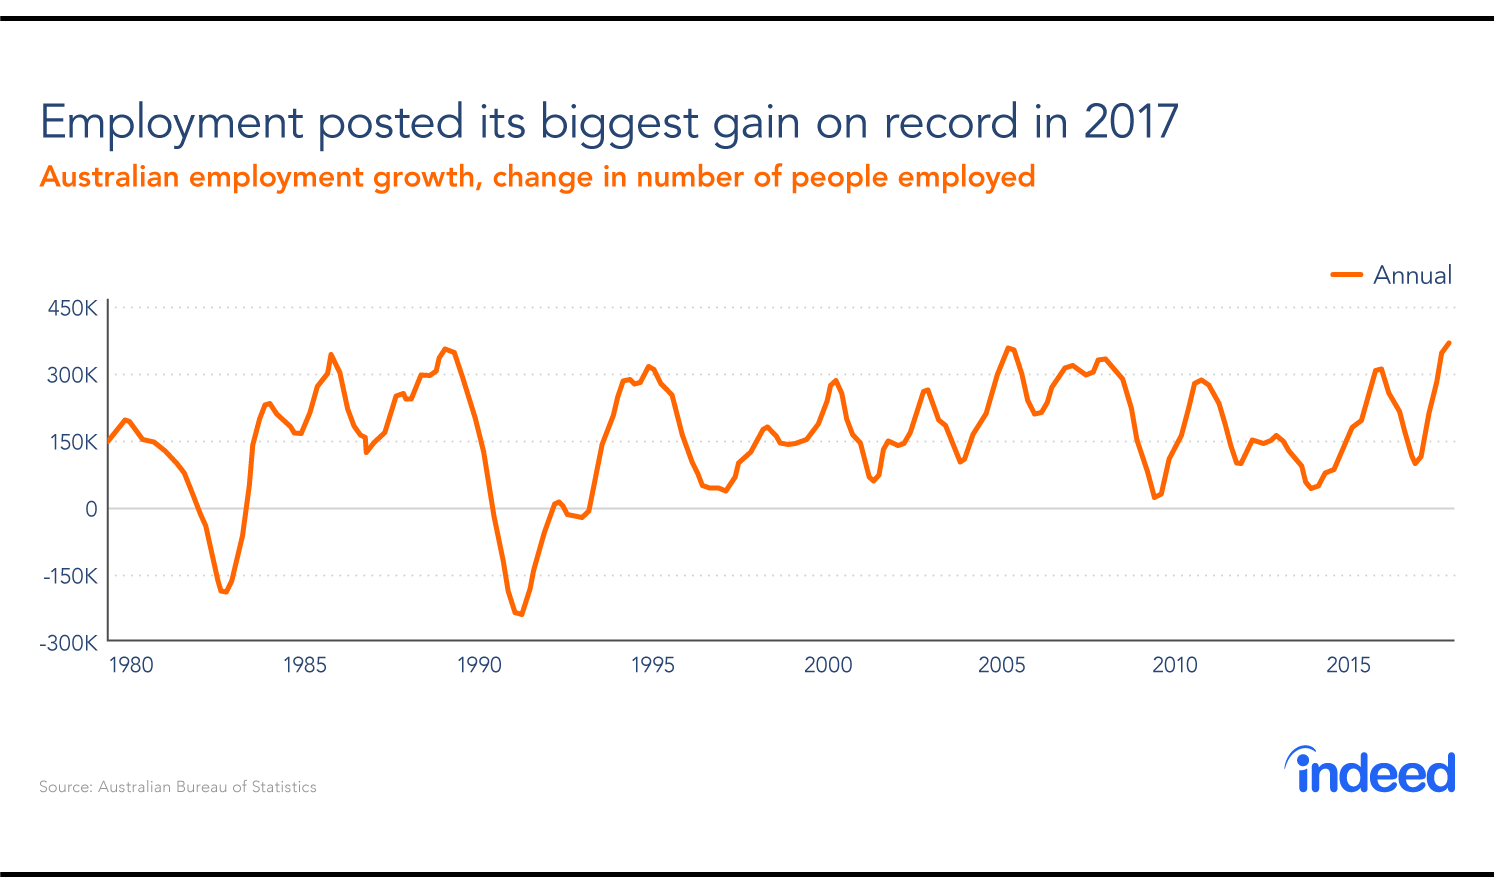
- Employment gains in 2017 were the strongest Australia has experienced since 2005.
- Wage growth continues to disappoint and hasn’t yet shown signs of improvement.
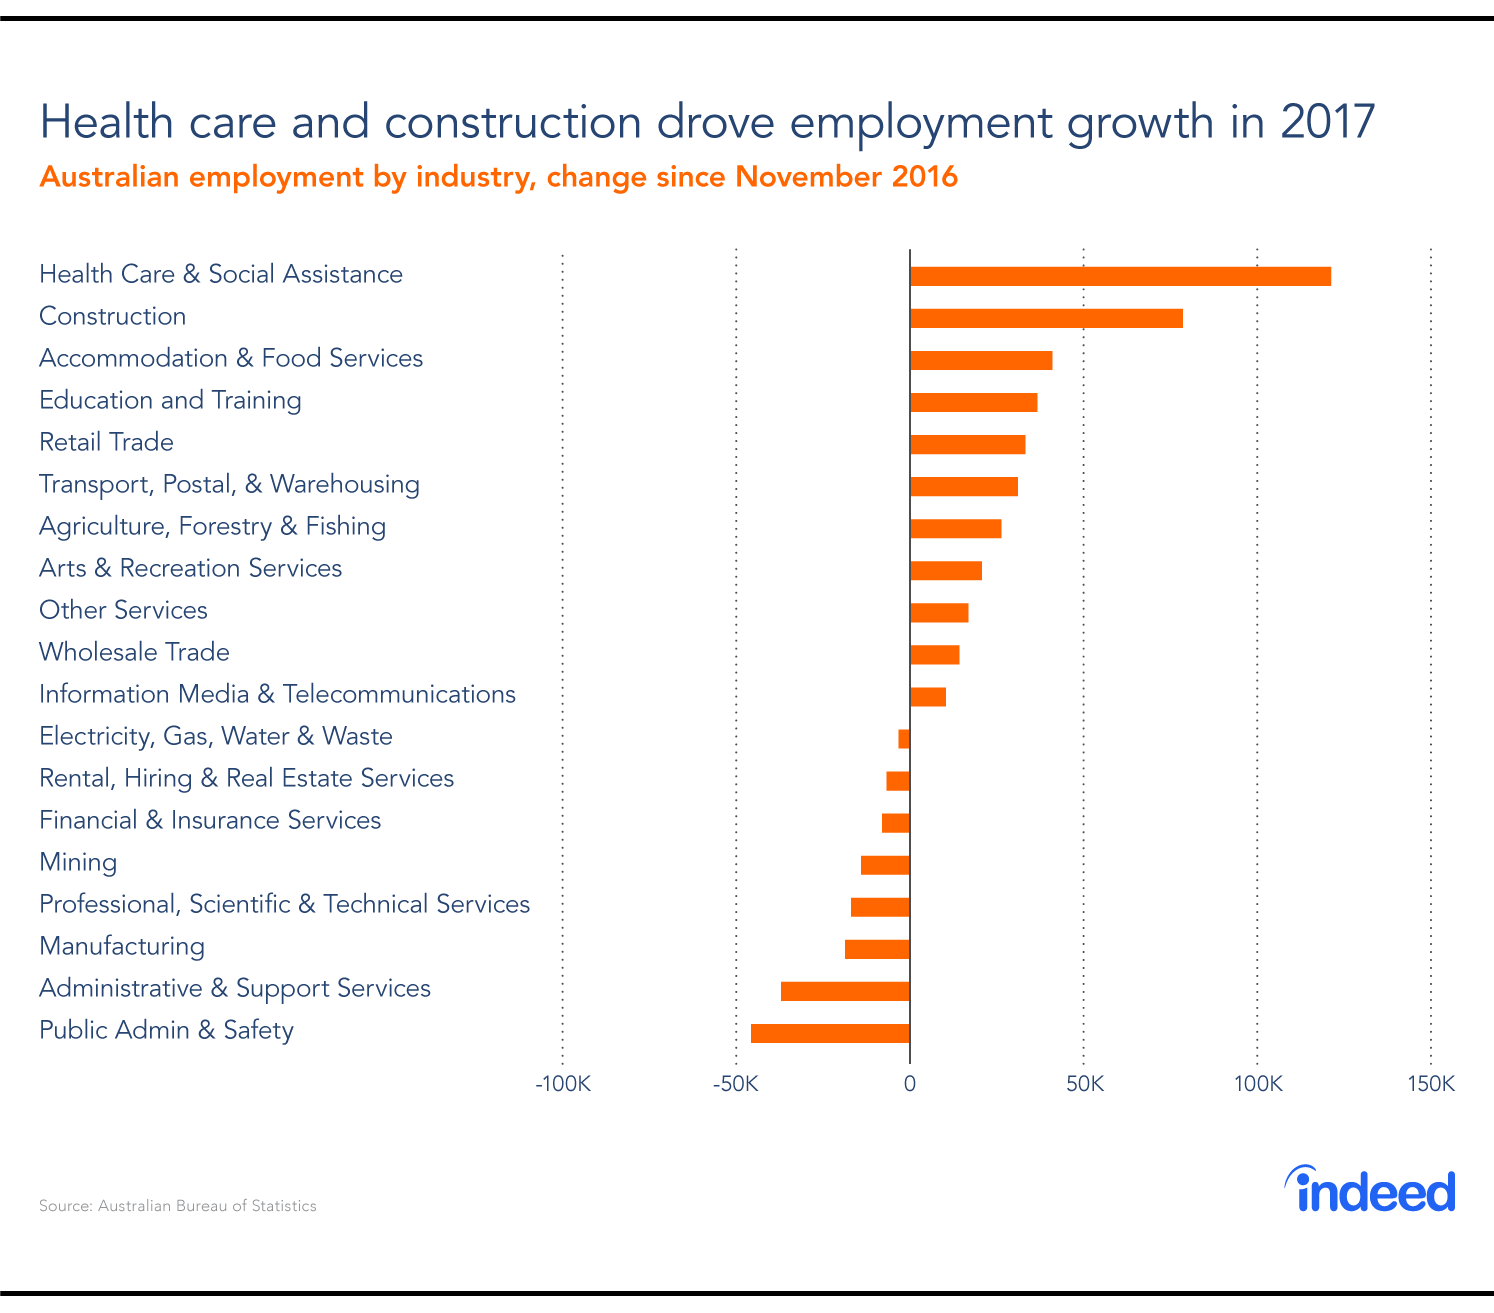
- Healthcare, construction and hospitality registered the strongest employment growth during the year.
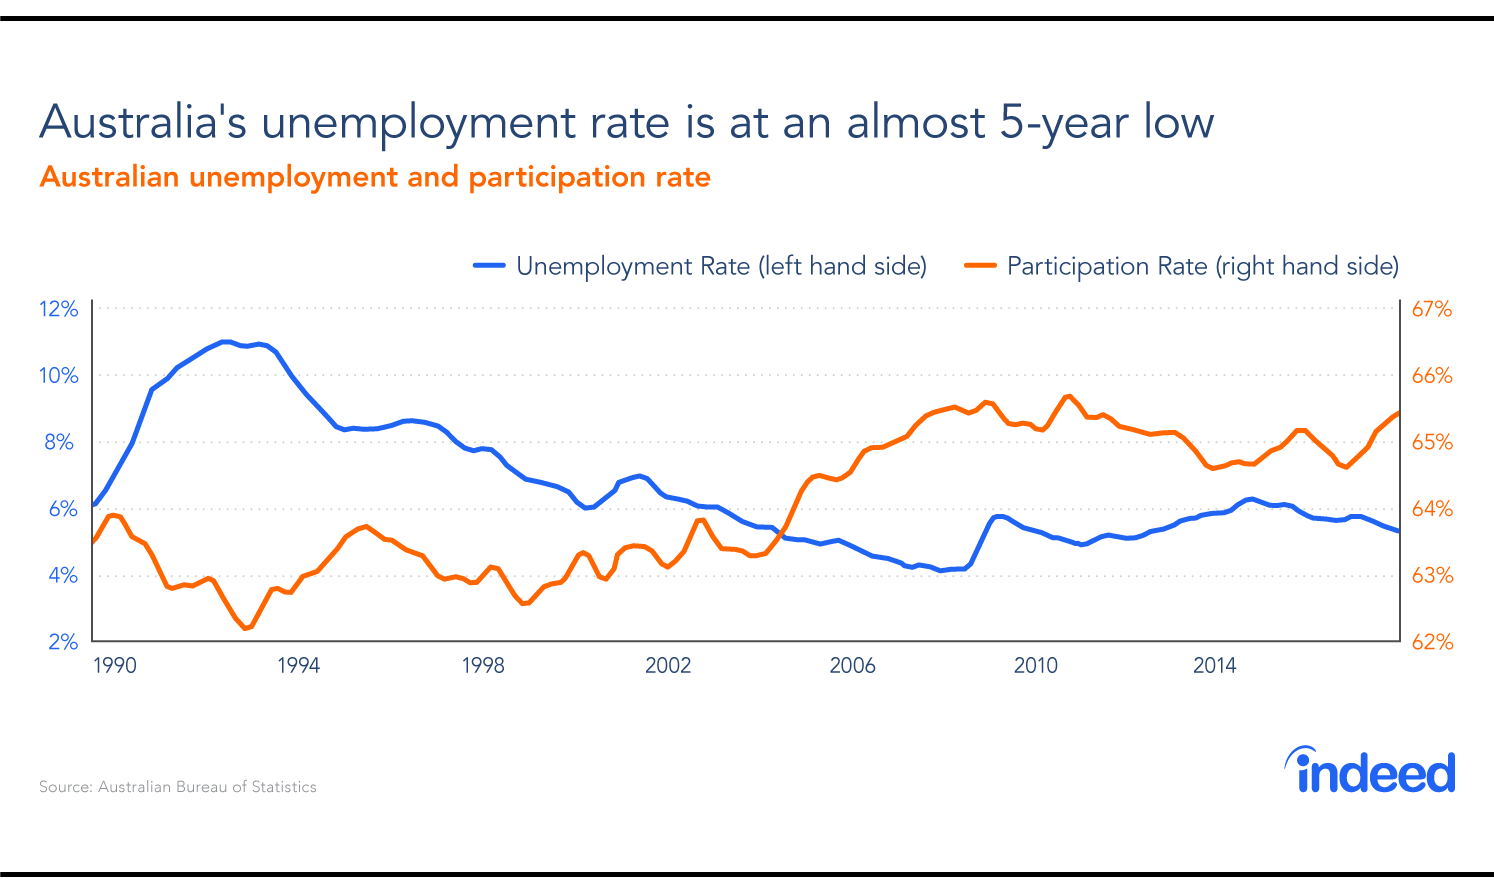
The Australian labour market enjoyed a remarkable run throughout 2017. Employment has swelled by 371,000 people since the beginning of the year–the strongest gains on record–while the unemployment rate fell to an almost five-year low. Even better news: 84% of the new jobs created were full-time positions. That said, labour market slack remains high and it may take a number of years before the unemployment rate falls below 5%.
However, while most labour market measures improved during the year, a key one failed to impress: wage growth. Pay gains remained near a multi-decade low during 2017 despite a sizable increase in the minimum wage, forcing many households to tighten their belts. Low wage growth is the most pressing economic issue facing Australia as we enter 2018.
Employment growth exceeds all expectations
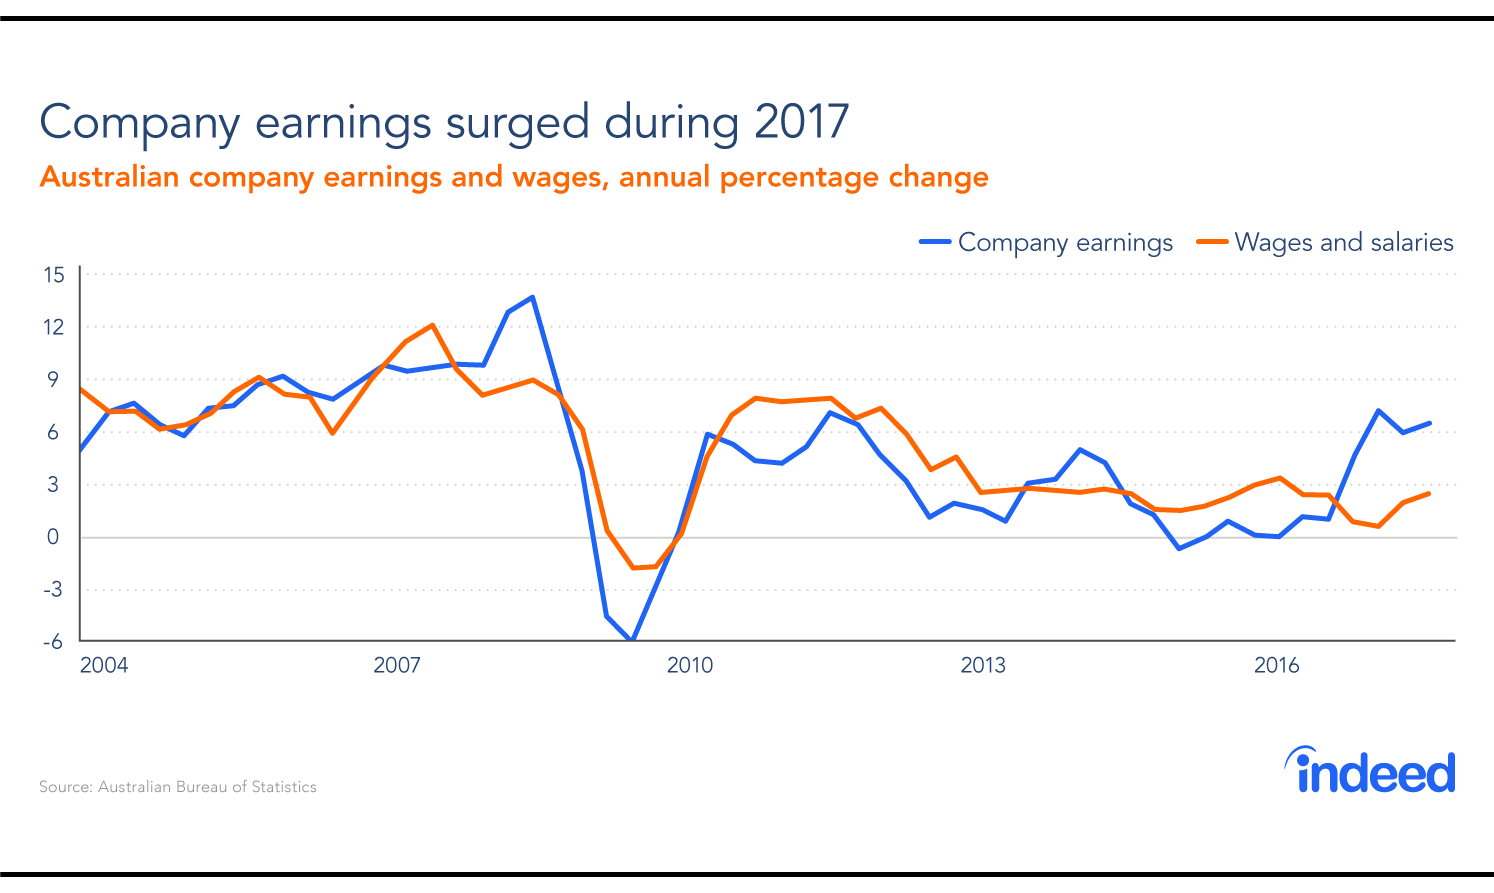
Strong employment growth throughout 2017 reflects improving business conditions and greater employer confidence. Over the past year, corporate earnings have increased 6.5%, while operating profits are up 20%. Corporations, now flush with cash, invested and expanded–and that required additional staff. Meanwhile, the ANZ Job Advertisements measure, which counts online and newspaper job ads, points toward strong employment growth in the new year.
With more people finding work, it was no surprise that the unemployment rate tumbled to an almost five-year low. Workforce participation–the percentage of the working-age population employed or actively looking for work–also rose sharply throughout 2017 and is now at its highest level in six years.
That’s impressive since, as we noted earlier this year, Australia’s ageing population puts downward pressure on labour force participation. At least in 2017, that pressure was offset by higher participation among most age groups.
Healthcare and construction jobs drive growth
Growth was largely concentrated in healthcare, construction, and accommodation and food services. All three have been boom sectors in Australia. High demand for healthcare workers reflects Australia’s ageing population. Construction workers are needed because residential building is booming. And the hospitality sector needs workers to service Australia’s unquenchable taste for fancy food.
Perhaps the most interesting story was in the retail sector. Employment growth was strong despite deteriorating retail conditions in the second half of 2017. Hiring has continued leading up to the Christmas holidays, and holiday job postings are much stronger than they were last year.
Despite improved business conditions, manufacturing and mining employment continue to fall. High labour costs and a strong Australian dollar create a difficult environment for factory operators. Meanwhile, mining employment keeps declining as projects shift from the labour-intensive investment phase to production.
Wages continue to disappoint
As 2017 progressed, wages became the focus of Australia’s economic debate. Policymakers expected wage growth to pick up, but it didn’t happen. Increasingly lacklustre wage growth holds down inflation and interest rates. And it weighs on household spending and makes it more difficult for households to manage their debt burdens.
Happily, there are reasons for optimism regarding wage growth in 2018. First, businesses are reporting it’s harder to find new staff. When that occurs employers become willing to pay more to find the right candidates. Second, corporations are rolling in cash thanks to a 6.5% jump in corporate earnings over the past year.
Historically, corporate earnings and wage growth have moved in tandem. Cashed-up businesses typically hire new staff and are more prepared to reward their employees for a job well done. With earnings up, it may be is the best time in a decade for employees to ask for a raise.
Highlight: the return of full-time employment
Full-time employment accounted for 84% of employment growth in 2017. This helps reverse one of the more notable hiring trends since the global financial crisis: the shift toward part-time and casual employment.
The surge in part-time employment since the crisis has been both a blessing and a curse. It kept people employed during a difficult period and created thousands of opportunities for workers who value a flexible workplace. This especially benefited female employees, who still carry a greater burden of childcare and housekeeping, and older workers. But it came at a cost. Over 1.1 million Australians are working fewer hours than they’d like–on top of the 700,000 people who are unemployed.
Much of the labour market debate focuses on whether good jobs are being created. Certainly, work in the “gig economy” does not always mean long-term secure positions. However, in 2017, job creation was concentrated in high-quality full-time roles.
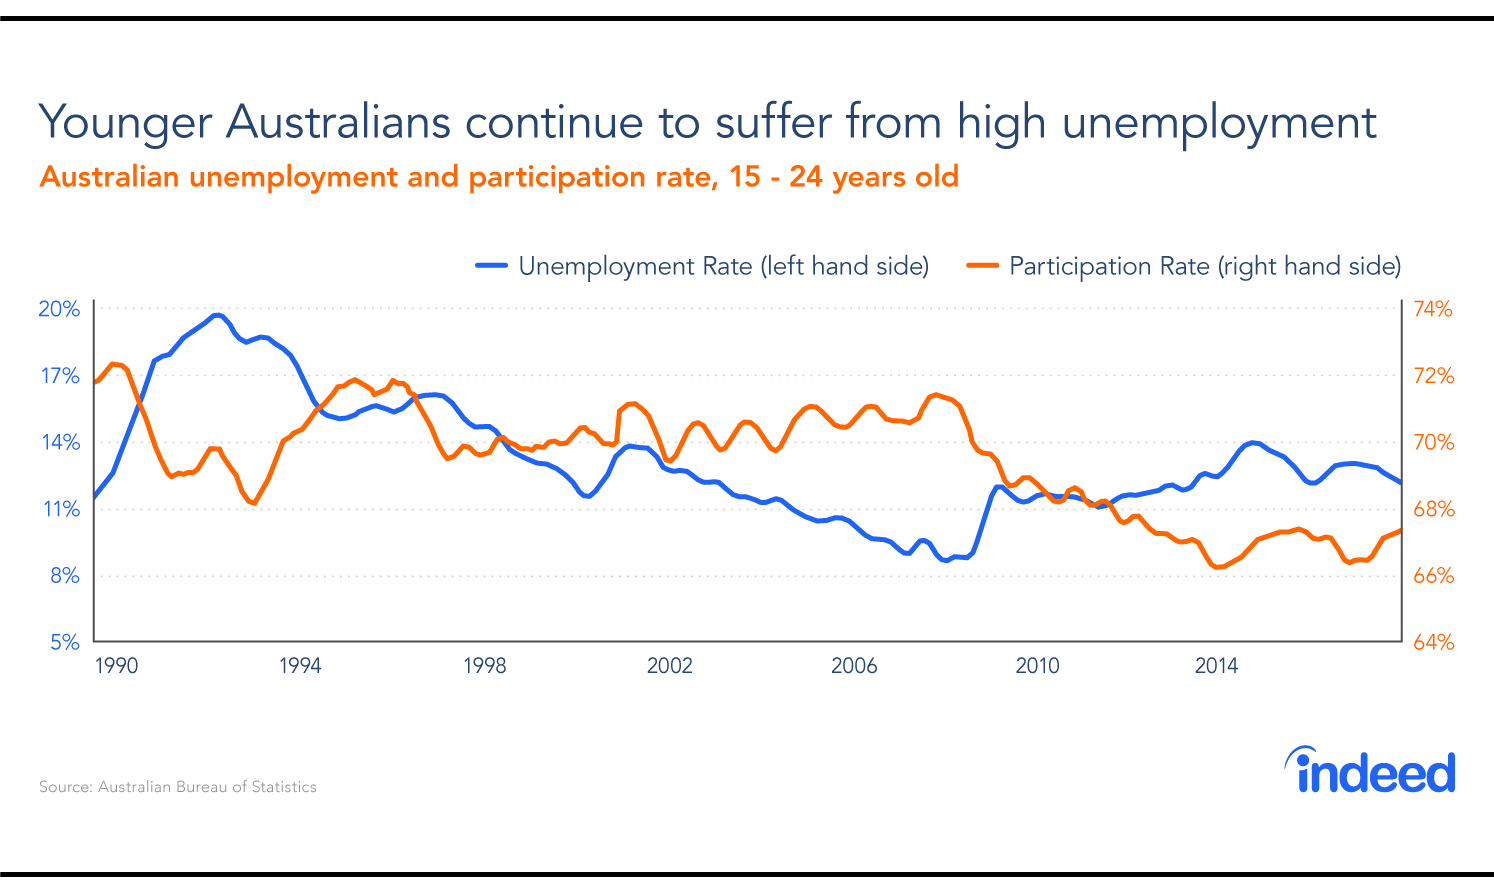
Lowlight: youth unemployment
There was one significant downer in Australia’s labour market in 2017–youth unemployment remains far too high. While improvements have been made, the jobless rate among workers 15-24 years is still above 12%. Furthermore, participation among young Australians remains well below its pre-crisis level.
A large share of workers now take their first full-time job with less experience than their counterparts had a decade earlier. Even as we celebrate a remarkable year for Australian employment growth, we must acknowledge that younger workers have been left behind.