Polarization marked 2017, the first year of President Trump’s administration. The presidential vote itself was more sharply divided than in previous elections, split by geography and demographics. Republicans and Democrats seemed to disagree on just about everything, including trusting the media, broad political values and economic expectations. On that last point, since the election, consumer sentiment has skyrocketed among Republicans and fallen among Democrats.
But there was one notable exception to the polarization trend last year—the job market. During the past year, job growth was similar in blue- and red-leaning industries, and in blue and red states. That’s a shift: Red America lagged blue America throughout much of 2015 and 2016, but, in 2017, it caught up. The same thing happened with unemployment—its fall was shared by left and right. People without a college degree—both Whites, who voted more for Trump, and people of other races and Hispanics, who voted strongly for Clinton—saw larger drops in unemployment and gains in wages than the college-educated. In other words, labor market gains in 2017 had more to do with narrowing economic gaps than the widening partisan divide.
But these are short-term trends. In the longer run, policy changes backed by the Trump administration could favor red industries and states, while longer-term economic trends might lean blue.
Red industries and red states gained ground in 2017
What do we mean by red and blue industries? We define industry sectors as red or blue based on how their workers voted according to the Cooperative Congressional Election Study (CCES) post-election survey of nearly 50,000 voters. (In retail, the vote was nearly even, so let’s call that sector purple.) Both red and blue sectors notched solid job growth last year, but red ones led the pack. The two fastest-growing sectors, mining, and construction, both lean red. Manufacturing also leans red, and its job growth edged ahead of the national growth rate in 2017 after losing jobs in 2016. Furthermore, in 2017, earnings increased most in production, transportation, and material moving occupations, which are found mainly in red industry sectors.
The bluest sectors are leisure and hospitality, education and health services, and professional and business services. They too all grew faster than the national rate in 2017. Three sectors lost jobs and they spanned the partisan divide: one blue (information), one red (utilities) and one purple (retail).
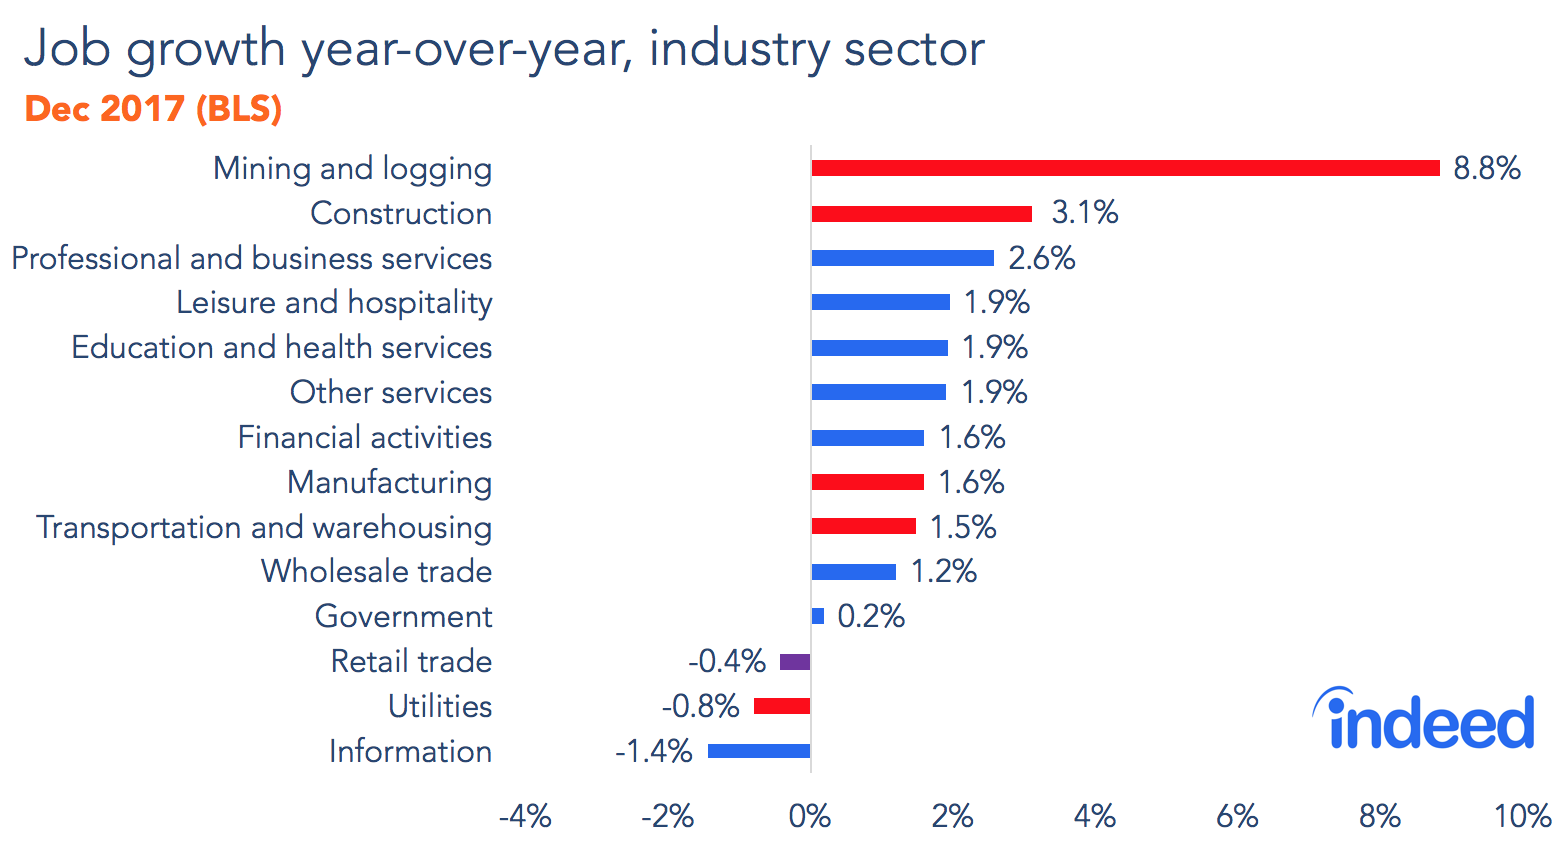
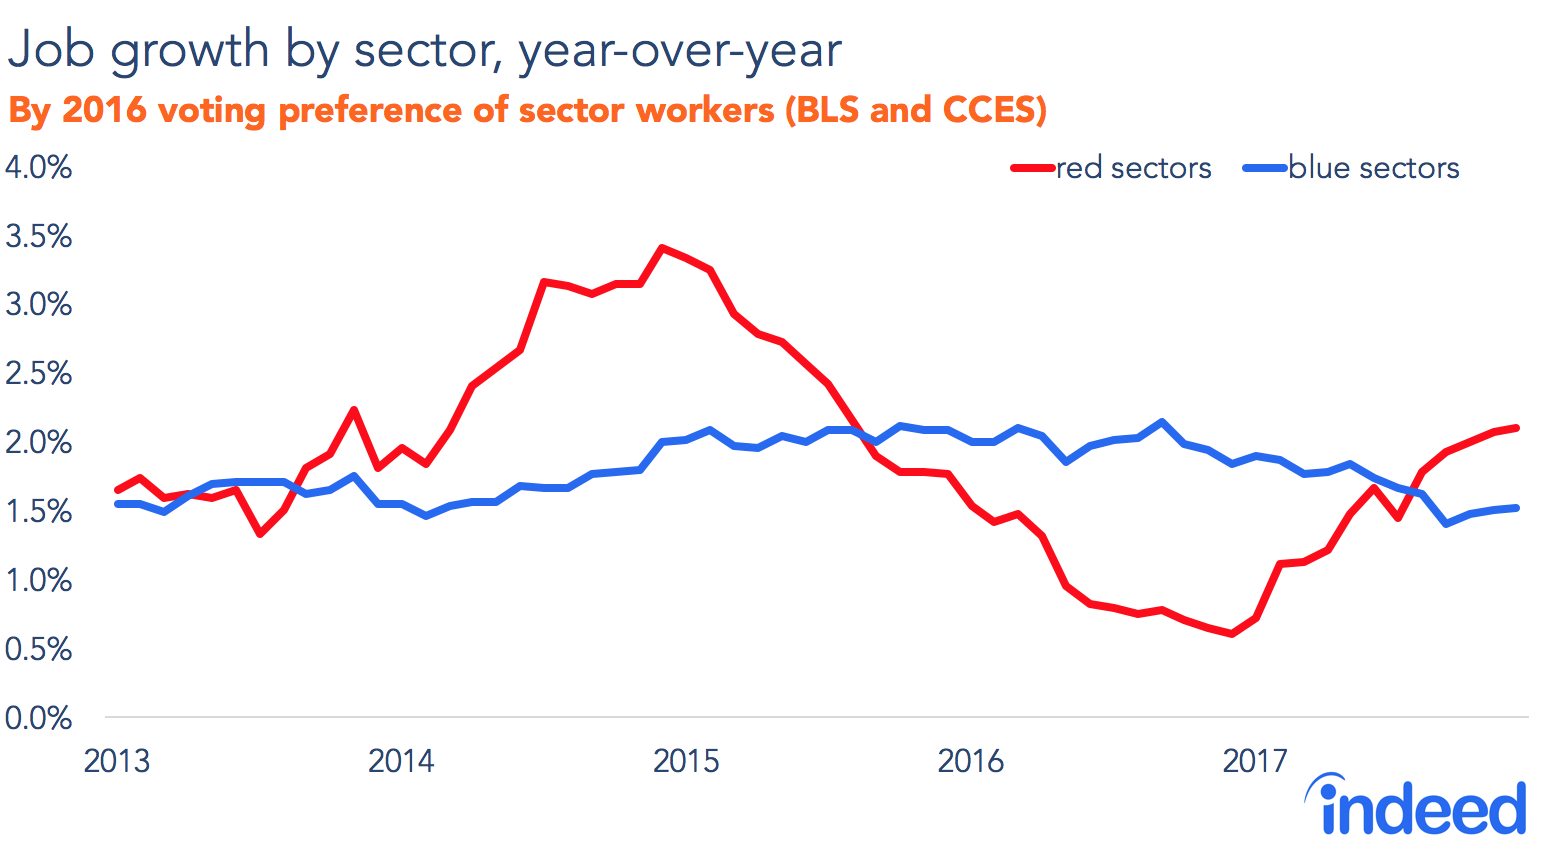
Leaving out retail, red sectors outpaced blue sectors as measured by December 2017 year-over-year job growth, 2.1% to 1.5%. While the gap isn’t huge, it’s a notable reversal from December 2016, when year-over-year red-sector job growth was just 0.6%, compared with 1.8% in blue sectors.
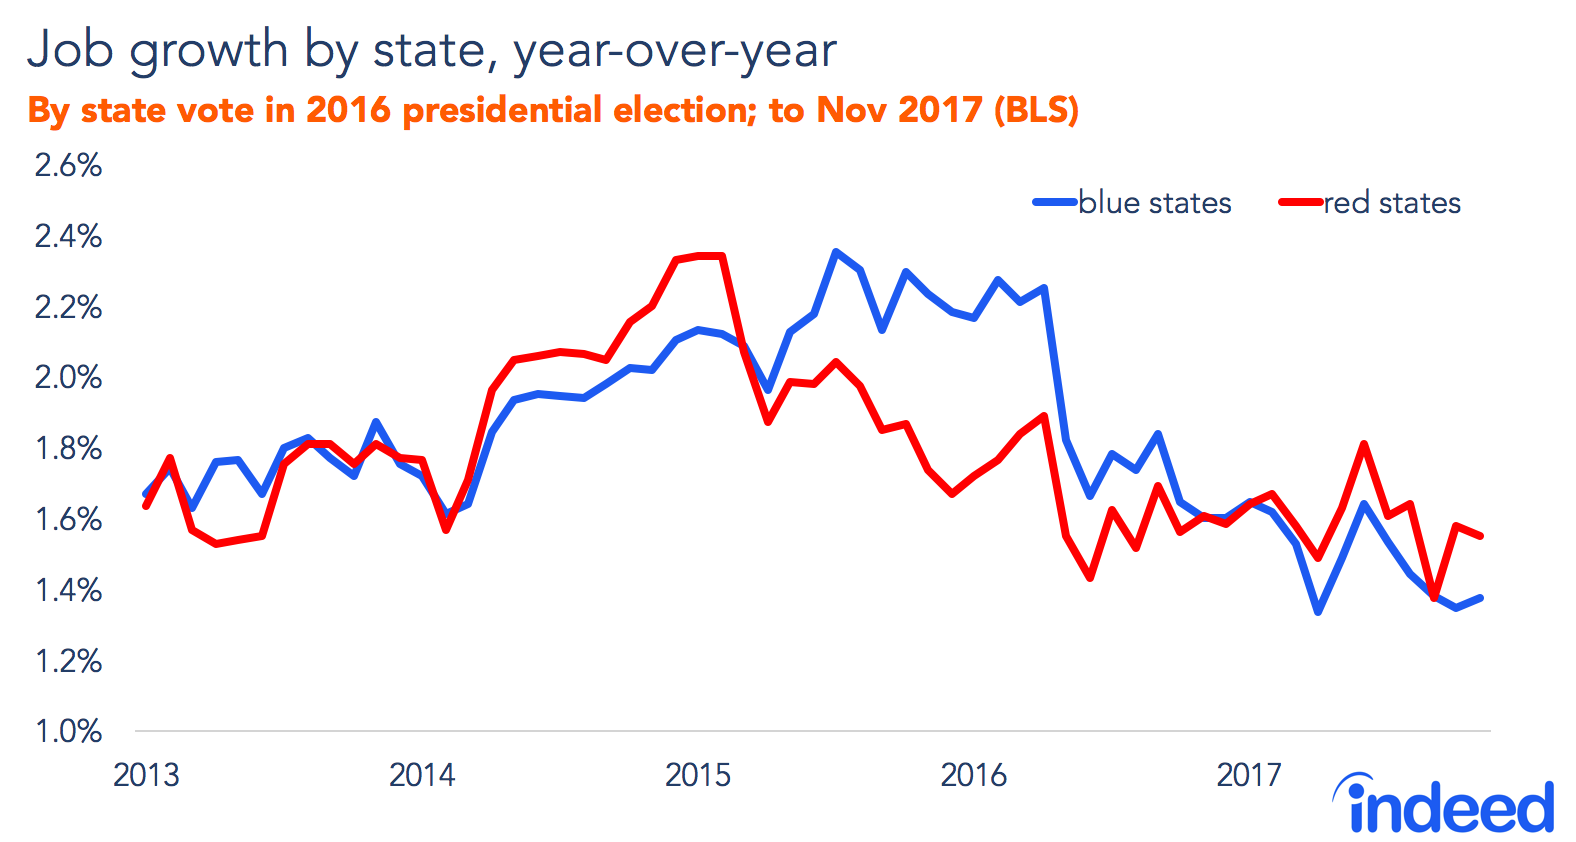
A similar pattern is visible when we look at states instead of industries. In 2017, red states grew slightly faster than blue states, making up some of the ground they lost in 2015 and 2016. In November (the latest data available from the Bureau of Labor Statistics [BLS]), year-over-year job growth was 1.6% in states Trump won versus 1.4% in states Clinton carried. The fastest-growing states included red Texas and Florida as well as blue Maryland and Washington. The states losing jobs included blue Connecticut and red Alaska, West Virginia and Wyoming.
Employment measures improved for both red and blue voters
Job growth slowed in 2017, as we’d expect at this later stage of a recovery. At the same time though, unemployment and other individual labor market measures improved at an accelerating rate. The decline in unemployment—like job growth—cut across red and blue America.
For this analysis, we categorize people into three groups based on race and education, which were the most important predictors of the 2016 vote: (1) people with a college degree; (2) non-Hispanic White people without a college degree; and (3) people of other races, including Hispanics, without a college degree.
In 2017, college-educated adults gained modestly in the labor market. Their unemployment rate edged down 0.2 percentage point to 2.3%. Unemployment fell more for adults without a college degree—both among non-Hispanic Whites, who supported Trump strongly, and Hispanics and non-Whites, who voted overwhelmingly for Clinton. Broader employment measures include the U-6 underemployment rate (which adds people who want a job but are too discouraged to look and those working part time who would prefer full-time work) and the prime-age employment-population ratio (which measures the percentage of working-age people holding jobs). Both these indicators also improved more for the two groups lacking a college degree than for the college-educated.
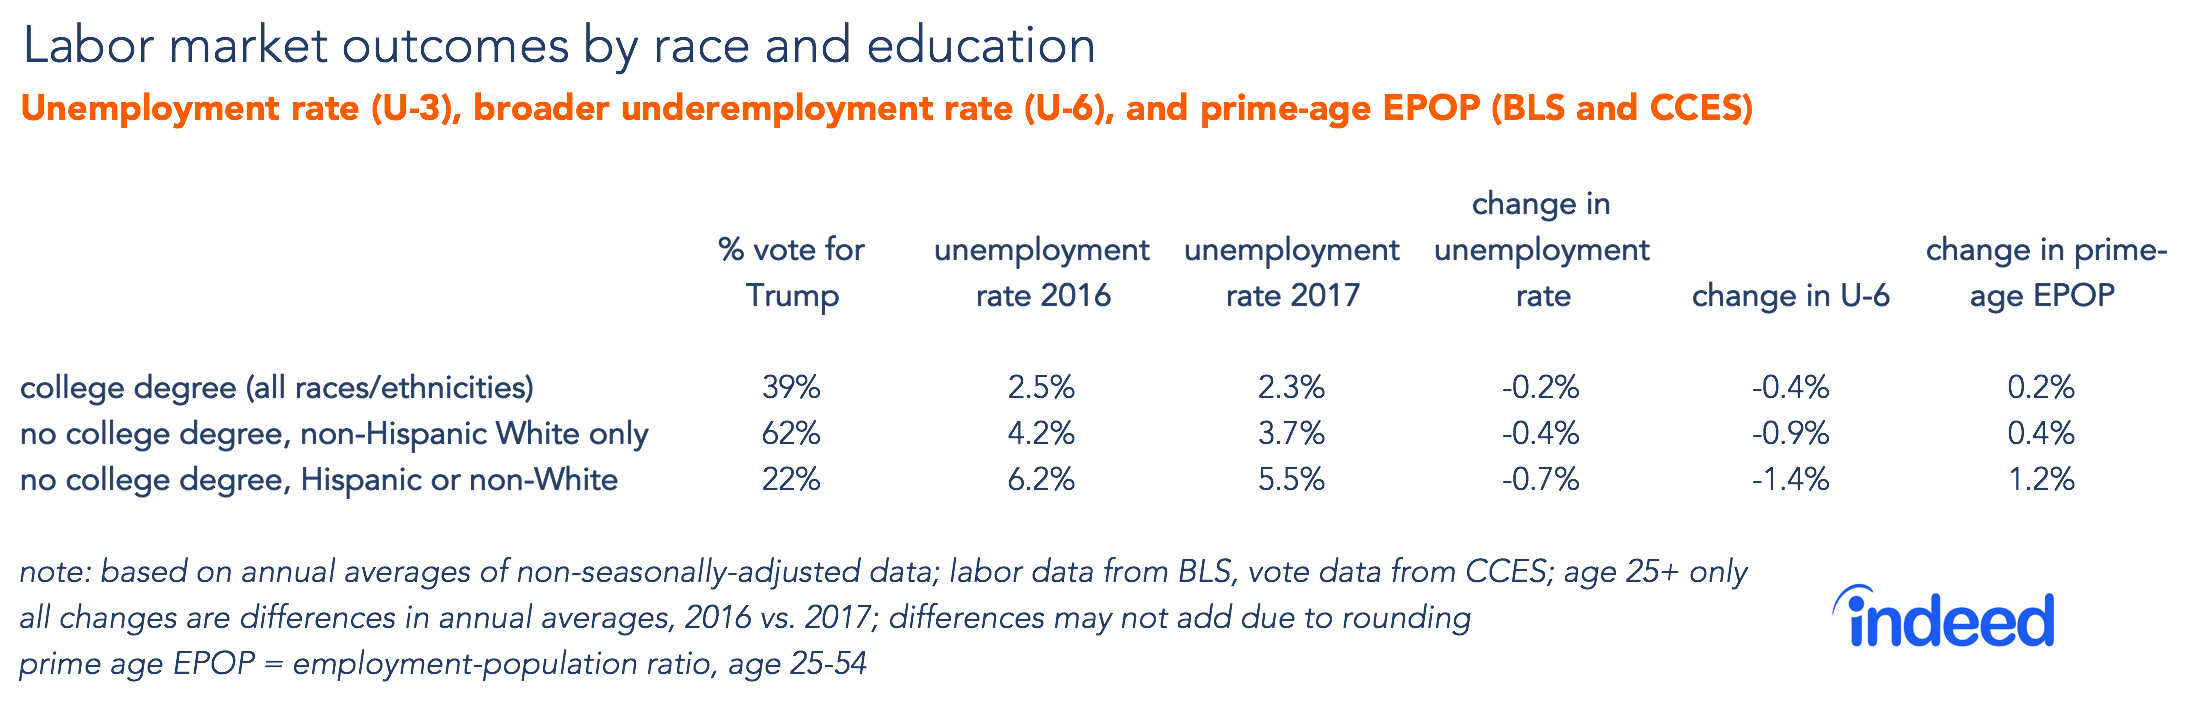
Among those without a college degree, labor-market measures advanced more for Hispanics and non-Whites, illustrating how labor-market gaps narrowed in 2017. Gaps narrowed in wages too, with pay rising most in 2017 for the lowest earners and among workers with a high-school degree or less.
Will red and blue America keep on sharing labor market gains?
The improving labor market in 2017 was a rare point of shared success for red and blue America. What are the chances that will continue? It looks to be a delicate balance and could be blown off course in either direction.
In one direction, public policy could favor growth in red industry sectors or red states. This was probably not a factor in 2017. Job growth accelerated in red states and sectors starting late in 2016 and early in 2017, before any policy shifts by the new Trump administration could affect hiring. But one of Trump’s campaign promises was to bring back jobs in manufacturing, a red-leaning sector. And elements of the recent tax reform package could favor red America, such as the limitation on individual state and local tax deductions and the corporate tax changes.
In the other direction, projected shifts in the economy could favor job growth in blue sectors and places. Routine jobs–those that are most at risk from automation—are more concentrated in Republican-leaning geographies. Furthermore, the impressive revival of manufacturing job growth may be temporary. The BLS projects that factory jobs will decline over the next decade. Using these BLS projections, we estimate that occupations clustered in red counties are more likely to shrink than occupations concentrated in blue counties.
For these reasons, labor market gaps between red and blue America could widen again in the years ahead. That might not affect politics in the short term. After all, President Trump’s approval ratings are low relative to the strength of the economy. Plus, his popularity has fallen nearly as much among those without a college degree as among the college-educated, even though those without degrees have gained more dramatically in the labor market. But, for now at least, the labor market is one of the few things that both sides of America’s political divide can cheer.